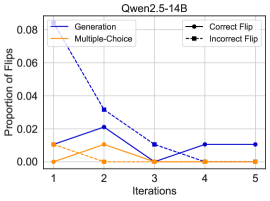
## Line Chart: Qwen2.5-14B
### Overview
The chart illustrates the proportion of flips (correct and incorrect) for two methods—**Generation** and **Multiple-Choice**—across five iterations. The y-axis represents the proportion of flips (0.00 to 0.08), while the x-axis denotes iterations (1 to 5). Two lines are plotted: a blue line for **Generation** and an orange line for **Multiple-Choice**, with markers indicating correct (solid circles) and incorrect (squares) flips.
### Components/Axes
- **X-axis (Iterations)**: Labeled "Iterations" with discrete values 1, 2, 3, 4, 5.
- **Y-axis (Proportion of Flips)**: Labeled "Proportion of Flips" with a scale from 0.00 to 0.08.
- **Legend**: Located in the top-right corner, with:
- **Blue line**: "Generation" (solid circles for correct flips, squares for incorrect flips).
- **Orange line**: "Multiple-Choice" (solid circles for correct flips, squares for incorrect flips).
### Detailed Analysis
- **Generation (Blue Line)**:
- **Iteration 1**: Proportion of flips = ~0.08 (highest value).
- **Iteration 2**: Proportion of flips = ~0.03 (sharp decline).
- **Iterations 3–5**: Proportion of flips stabilizes at ~0.01.
- **Trend**: Steep decline from iteration 1 to 2, followed by stabilization.
- **Multiple-Choice (Orange Line)**:
- **Iteration 1**: Proportion of flips = ~0.01.
- **Iteration 2**: Proportion of flips = ~0.02 (peak).
- **Iterations 3–5**: Proportion of flips drops to ~0.00.
- **Trend**: Initial increase to iteration 2, then sharp decline.
### Key Observations
1. **Generation** shows a significant drop in flips after iteration 2, suggesting improved stability or reduced errors.
2. **Multiple-Choice** exhibits a brief spike in flips at iteration 2, followed by near-zero values, indicating potential overcorrection or method-specific instability.
3. **Correct vs. Incorrect Flips**: The legend distinguishes markers, but the chart does not explicitly separate correct/incorrect proportions. The lines likely represent total flips, with markers indicating the type (e.g., solid circles for correct, squares for incorrect). However, the data points do not provide explicit splits between correct and incorrect flips.
### Interpretation
- The **Generation** method demonstrates a clear trend of reducing flips over iterations, which may reflect improved performance or error correction. The initial high proportion of flips (0.08) suggests significant variability or errors in early iterations.
- The **Multiple-Choice** method shows a transient increase in flips at iteration 2, which could indicate a temporary issue or a methodological shift. Its subsequent drop to near-zero values implies stabilization or a lack of further flips.
- The **correct/incorrect flip markers** are visually distinct but lack explicit numerical data, making it challenging to quantify the exact proportion of correct vs. incorrect flips. This ambiguity limits deeper analysis of error types.
- The chart highlights the importance of iteration in refining model behavior, with **Generation** showing more consistent improvement compared to **Multiple-Choice**.