## Diagram: Node-Based Structures A and B
### Overview
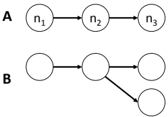
The image presents two distinct node-based diagrams labeled **A** and **B**. Diagram A depicts a linear sequence of three nodes, while Diagram B illustrates a branched structure with shared and divergent connections. No numerical data, legends, or color-coded elements are present.
### Components/Axes
- **Diagram A**:
- Nodes: `n₁` → `n₂` → `n₃` (linear chain).
- Arrows indicate unidirectional flow or dependency.
- **Diagram B**:
- Nodes: A central node (unlabeled) connects to three branches:
- One branch leads to an unlabeled node.
- Another branch leads to `n₃`.
- A third branch leads to `n₄`.
- Arrows suggest directional relationships, with `n₃` and `n₄` sharing a common predecessor.
### Detailed Analysis
- **Diagram A**:
- Sequential flow: `n₁` → `n₂` → `n₃`.
- No feedback loops or alternative pathways.
- **Diagram B**:
- Branching at the central node:
- One path terminates at an unlabeled node.
- Two paths converge at `n₃` and `n₄`, respectively.
- No explicit labels for the central node or the unlabeled terminal node.
### Key Observations
1. **Structural Contrast**:
- Diagram A represents a strictly linear progression.
- Diagram B introduces divergence, with `n₃` and `n₄` sharing a common origin but no direct connection between them.
2. **Ambiguity in Labels**:
- The central node in Diagram B and the unlabeled terminal node lack identifiers, limiting interpretability.
3. **Arrow Consistency**:
- All arrows in both diagrams point forward, suggesting unidirectional relationships.
### Interpretation
- **Functional Implications**:
- Diagram A could model a linear process (e.g., workflow, data pipeline).
- Diagram B might represent a decision tree or network with parallel pathways, where `n₃` and `n₄` are outcomes of a shared decision node.
- **Missing Context**:
- The absence of labels for critical nodes (e.g., the central node in B) reduces clarity.
- No indication of node weights, probabilities, or feedback mechanisms.
- **Potential Use Cases**:
- Diagram A: Suitable for systems requiring strict sequential execution.
- Diagram B: Useful for modeling scenarios with branching logic (e.g., user journeys, risk assessment).
## Notes
- No numerical data, legends, or color-coding present.
- All textual elements are node labels (`n₁`, `n₂`, `n₃`, `n₄`) and diagram identifiers (A, B).
- Arrows denote directionality but lack explicit semantics (e.g., causality, dependency).