## Heatmap: Classification Accuracies
### Overview
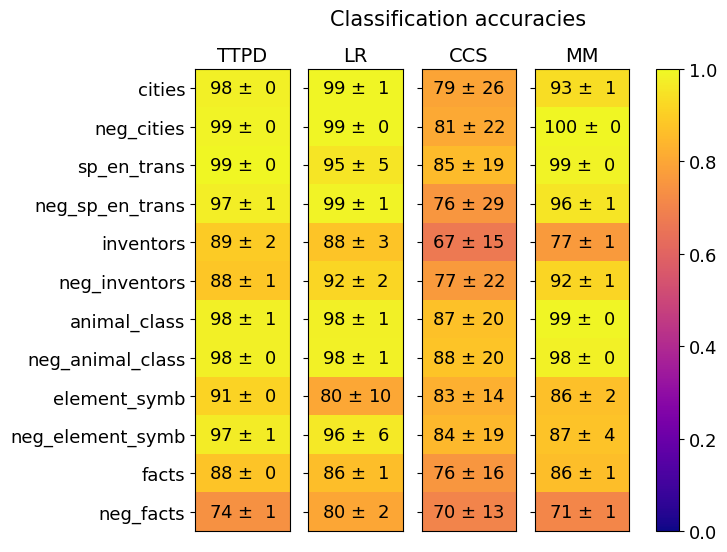
The image is a heatmap displaying classification accuracies for different categories using four different methods: TTPD, LR, CCS, and MM. The heatmap uses a color gradient from dark blue (0.0) to bright yellow (1.0) to represent the accuracy values. Each cell contains the accuracy value and its associated uncertainty (± value).
### Components/Axes
* **Title:** Classification accuracies
* **Columns (Methods):** TTPD, LR, CCS, MM
* **Rows (Categories):** cities, neg\_cities, sp\_en\_trans, neg\_sp\_en\_trans, inventors, neg\_inventors, animal\_class, neg\_animal\_class, element\_symb, neg\_element\_symb, facts, neg\_facts
* **Colorbar (Accuracy):** Ranges from 0.0 (dark blue) to 1.0 (bright yellow), with intermediate values indicated.
### Detailed Analysis
The heatmap presents classification accuracies for 12 categories across four different methods. Each cell displays the accuracy value ± its uncertainty.
Here's a breakdown of the values:
* **cities:**
* TTPD: 98 ± 0
* LR: 99 ± 1
* CCS: 79 ± 26
* MM: 93 ± 1
* **neg\_cities:**
* TTPD: 99 ± 0
* LR: 99 ± 0
* CCS: 81 ± 22
* MM: 100 ± 0
* **sp\_en\_trans:**
* TTPD: 99 ± 0
* LR: 95 ± 5
* CCS: 85 ± 19
* MM: 99 ± 0
* **neg\_sp\_en\_trans:**
* TTPD: 97 ± 1
* LR: 99 ± 1
* CCS: 76 ± 29
* MM: 96 ± 1
* **inventors:**
* TTPD: 89 ± 2
* LR: 88 ± 3
* CCS: 67 ± 15
* MM: 77 ± 1
* **neg\_inventors:**
* TTPD: 88 ± 1
* LR: 92 ± 2
* CCS: 77 ± 22
* MM: 92 ± 1
* **animal\_class:**
* TTPD: 98 ± 1
* LR: 98 ± 1
* CCS: 87 ± 20
* MM: 99 ± 0
* **neg\_animal\_class:**
* TTPD: 98 ± 0
* LR: 98 ± 1
* CCS: 88 ± 20
* MM: 98 ± 0
* **element\_symb:**
* TTPD: 91 ± 0
* LR: 80 ± 10
* CCS: 83 ± 14
* MM: 86 ± 2
* **neg\_element\_symb:**
* TTPD: 97 ± 1
* LR: 96 ± 6
* CCS: 84 ± 19
* MM: 87 ± 4
* **facts:**
* TTPD: 88 ± 0
* LR: 86 ± 1
* CCS: 76 ± 16
* MM: 86 ± 1
* **neg\_facts:**
* TTPD: 74 ± 1
* LR: 80 ± 2
* CCS: 70 ± 13
* MM: 71 ± 1
### Key Observations
* TTPD, LR, and MM generally show high accuracy across all categories, with values mostly in the 85-100 range.
* CCS tends to have lower accuracy and higher uncertainty compared to the other methods, especially for categories like "cities" and "neg\_sp\_en\_trans".
* The "inventors" category shows relatively lower accuracy for all methods compared to other categories.
* The color gradient visually confirms the numerical data, with brighter yellow indicating higher accuracy and darker shades indicating lower accuracy.
### Interpretation
The heatmap provides a visual comparison of the classification accuracies of four different methods across various categories. The data suggests that TTPD, LR, and MM perform consistently well across all categories, while CCS shows more variability and generally lower accuracy. The higher uncertainty associated with CCS indicates that its performance may be less reliable. The "inventors" category appears to be more challenging for all methods, suggesting that it may require a different approach or more sophisticated features for accurate classification. The heatmap effectively highlights the strengths and weaknesses of each method, allowing for informed decisions about which method is most suitable for a given category.