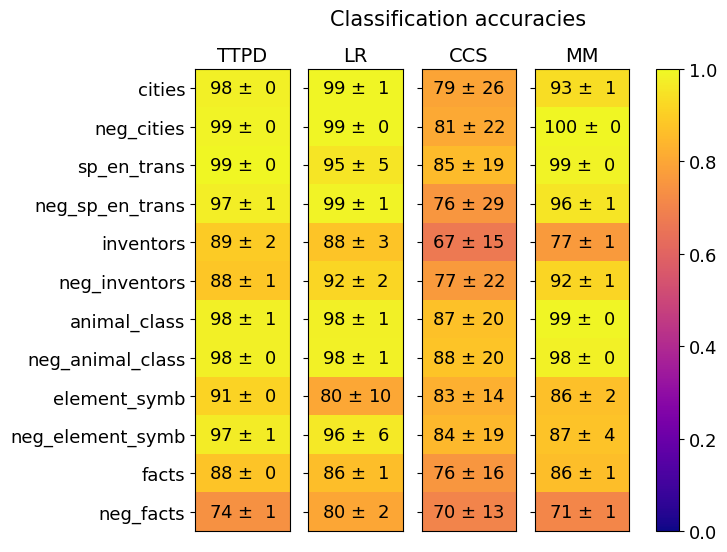
## Heatmap: Classification Accuracies
### Overview
This image presents a heatmap displaying classification accuracies for various categories across four different models: TTPD, LR, CCS, and MM. The heatmap uses a color gradient from dark blue (low accuracy) to yellow (high accuracy) to represent the accuracy values. Each cell in the heatmap corresponds to a specific category and model combination, with the accuracy value and its standard deviation displayed within the cell.
### Components/Axes
* **Rows (Categories):** cities, neg\_cities, sp\_en\_trans, neg\_sp\_en\_trans, inventors, neg\_inventors, animal\_class, neg\_animal\_class, element\_symb, neg\_element\_symb, facts, neg\_facts.
* **Columns (Models):** TTPD, LR, CCS, MM.
* **Color Scale (Accuracy):** Ranges from 0.0 (dark blue) to 1.0 (yellow). The scale is positioned on the right side of the heatmap.
* **Title:** "Classification accuracies" positioned at the top-center of the heatmap.
* **Cell Contents:** Each cell displays the accuracy value in the format "X ± Y", where X is the accuracy and Y is the standard deviation.
### Detailed Analysis
The heatmap contains 12 rows (categories) and 4 columns (models), resulting in 48 data points. The values are approximate, based on visual estimation.
**TTPD Column:**
* cities: 98 ± 0
* neg\_cities: 99 ± 0
* sp\_en\_trans: 99 ± 0
* neg\_sp\_en\_trans: 97 ± 1
* inventors: 89 ± 2
* neg\_inventors: 88 ± 1
* animal\_class: 98 ± 1
* neg\_animal\_class: 98 ± 0
* element\_symb: 91 ± 0
* neg\_element\_symb: 97 ± 1
* facts: 88 ± 0
* neg\_facts: 74 ± 1
**LR Column:**
* cities: 99 ± 1
* neg\_cities: 99 ± 0
* sp\_en\_trans: 95 ± 5
* neg\_sp\_en\_trans: 99 ± 1
* inventors: 88 ± 3
* neg\_inventors: 92 ± 2
* animal\_class: 98 ± 1
* neg\_animal\_class: 98 ± 1
* element\_symb: 80 ± 10
* neg\_element\_symb: 96 ± 6
* facts: 86 ± 1
* neg\_facts: 80 ± 2
**CCS Column:**
* cities: 79 ± 26
* neg\_cities: 81 ± 22
* sp\_en\_trans: 85 ± 19
* neg\_sp\_en\_trans: 76 ± 29
* inventors: 67 ± 15
* neg\_inventors: 77 ± 22
* animal\_class: 87 ± 20
* neg\_animal\_class: 88 ± 20
* element\_symb: 83 ± 14
* neg\_element\_symb: 84 ± 19
* facts: 76 ± 16
* neg\_facts: 70 ± 13
**MM Column:**
* cities: 93 ± 1
* neg\_cities: 100 ± 0
* sp\_en\_trans: 99 ± 0
* neg\_sp\_en\_trans: 96 ± 1
* inventors: 77 ± 1
* neg\_inventors: 92 ± 1
* animal\_class: 99 ± 0
* neg\_animal\_class: 98 ± 0
* element\_symb: 86 ± 2
* neg\_element\_symb: 87 ± 4
* facts: 86 ± 1
* neg\_facts: 71 ± 1
### Key Observations
* **High Accuracy:** The "neg\_cities" category consistently achieves the highest accuracy (100% for MM) across all models.
* **Low Accuracy:** The "CCS" model generally exhibits the lowest accuracies, particularly for "cities" (79 ± 26) and "inventors" (67 ± 15).
* **Standard Deviation:** The "cities" category in the CCS model has a very high standard deviation (±26), indicating significant variability in its classification accuracy.
* **Negative vs. Positive:** For most categories, the "neg\_" versions (e.g., neg\_cities, neg\_inventors) have similar or slightly higher accuracies than their positive counterparts.
* **Model Performance:** TTPD and LR generally perform well, with high accuracies across most categories. MM also shows strong performance, while CCS consistently lags behind.
### Interpretation
The heatmap provides a comparative analysis of the performance of four classification models across a range of categories. The data suggests that the models are generally effective at classifying the "neg\_" versions of the categories, potentially indicating that the negative examples are easier to identify. The consistently low performance of the CCS model suggests that it may be less suitable for this particular classification task. The high standard deviation for "cities" in the CCS model indicates that its performance is unstable and may be sensitive to the specific dataset or input. The overall trend shows that the models are capable of achieving high accuracy, but there is room for improvement, particularly for the CCS model and certain categories like "cities" and "inventors". The categories themselves appear to relate to different types of entities or concepts (cities, species, inventors, elements, facts), and the models' performance may vary depending on the complexity or ambiguity of these concepts.