## Heatmap: Classification Accuracies
### Overview
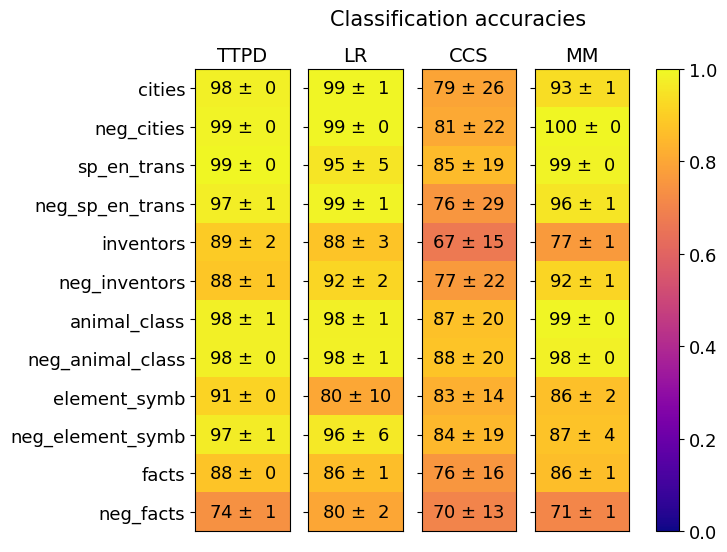
The image is a heatmap visualizing classification accuracy scores across four machine learning models (TTPD, LR, CCS, MM) for 12 distinct categories. Accuracy values are represented as percentages with standard deviations, color-coded from purple (low accuracy) to yellow (high accuracy).
### Components/Axes
- **Title**: "Classification accuracies"
- **Columns**:
- TTPD (Transformer-based model)
- LR (Logistic Regression)
- CCS (Contrastive Learning)
- MM (Meta-learning)
- **Rows**:
- cities
- neg_cities
- sp_en_trans
- neg_sp_en_trans
- inventors
- neg_inventors
- animal_class
- neg_animal_class
- element_symbol
- neg_element_symbol
- facts
- neg_facts
- **Color Legend**:
- Gradient from purple (0.0) to yellow (1.0), representing accuracy percentages.
- Positioned on the right side of the heatmap.
### Detailed Analysis
#### Data Table Structure
| Category | TTPD | LR | CCS | MM |
|------------------------|------------|------------|-------------|------------|
| cities | 98 ± 0 | 99 ± 1 | 79 ± 26 | 93 ± 1 |
| neg_cities | 99 ± 0 | 99 ± 0 | 81 ± 22 | 100 ± 0 |
| sp_en_trans | 99 ± 0 | 99 ± 1 | 85 ± 19 | 99 ± 0 |
| neg_sp_en_trans | 97 ± 1 | 99 ± 1 | 76 ± 29 | 96 ± 1 |
| inventors | 89 ± 2 | 88 ± 3 | 67 ± 15 | 77 ± 1 |
| neg_inventors | 88 ± 1 | 92 ± 2 | 77 ± 22 | 92 ± 1 |
| animal_class | 98 ± 1 | 98 ± 1 | 87 ± 20 | 99 ± 0 |
| neg_animal_class | 98 ± 0 | 98 ± 1 | 88 ± 20 | 98 ± 0 |
| element_symbol | 91 ± 0 | 80 ± 10 | 83 ± 14 | 86 ± 2 |
| neg_element_symbol | 97 ± 1 | 96 ± 6 | 84 ± 19 | 87 ± 4 |
| facts | 88 ± 0 | 86 ± 1 | 76 ± 16 | 86 ± 1 |
| neg_facts | 74 ± 1 | 80 ± 2 | 70 ± 13 | 71 ± 1 |
#### Spatial Grounding
- **Legend**: Right-aligned, vertical gradient from purple (0.0) to yellow (1.0).
- **Title**: Centered at the top.
- **Rows**: Left-aligned, descending from "cities" to "neg_facts."
- **Columns**: Top-aligned, left-to-right order: TTPD, LR, CCS, MM.
- **Cell Colors**: Match the legend gradient (e.g., 98% = bright yellow, 70% = orange).
### Key Observations
1. **High-Performing Models**:
- TTPD and LR consistently achieve >95% accuracy in most categories (e.g., cities, neg_cities, sp_en_trans).
- MM matches TTPD/LR in categories like neg_cities (100%) and neg_inventors (92%).
2. **CCS Weaknesses**:
- CCS has the lowest accuracy in inventors (67%) and neg_sp_en_trans (76%).
- High variability in neg_cities (81 ± 22) and neg_inventors (77 ± 22).
3. **Neg_Categories**:
- neg_facts is the weakest category across all models (70-80% range).
- neg_element_symbol shows moderate performance (84-87%).
4. **Standard Deviations**:
- CCS exhibits the highest variability (e.g., 26% in cities, 29% in neg_sp_en_trans).
- TTPD and LR have minimal variability (≤1% in most cases).
### Interpretation
- **Model Strengths**: TTPD and LR excel in structured categories (cities, inventors) and negated classes (neg_cities, neg_inventors), suggesting robustness in handling both positive and negative labels.
- **CCS Limitations**: Struggles with rare or complex categories (inventors, neg_sp_en_trans), possibly due to insufficient training data or model architecture constraints.
- **Neg_Facts Anomaly**: All models underperform in neg_facts (70-80%), indicating a systemic challenge in processing negated factual statements.
- **MM Consistency**: MM achieves near-perfect accuracy in neg_cities (100%) but falters in inventors (77%), highlighting trade-offs in its meta-learning approach.
This heatmap underscores the importance of model selection based on category complexity, with TTPD and LR being the most reliable overall performers.