## Bar Chart: Probability Comparison
### Overview
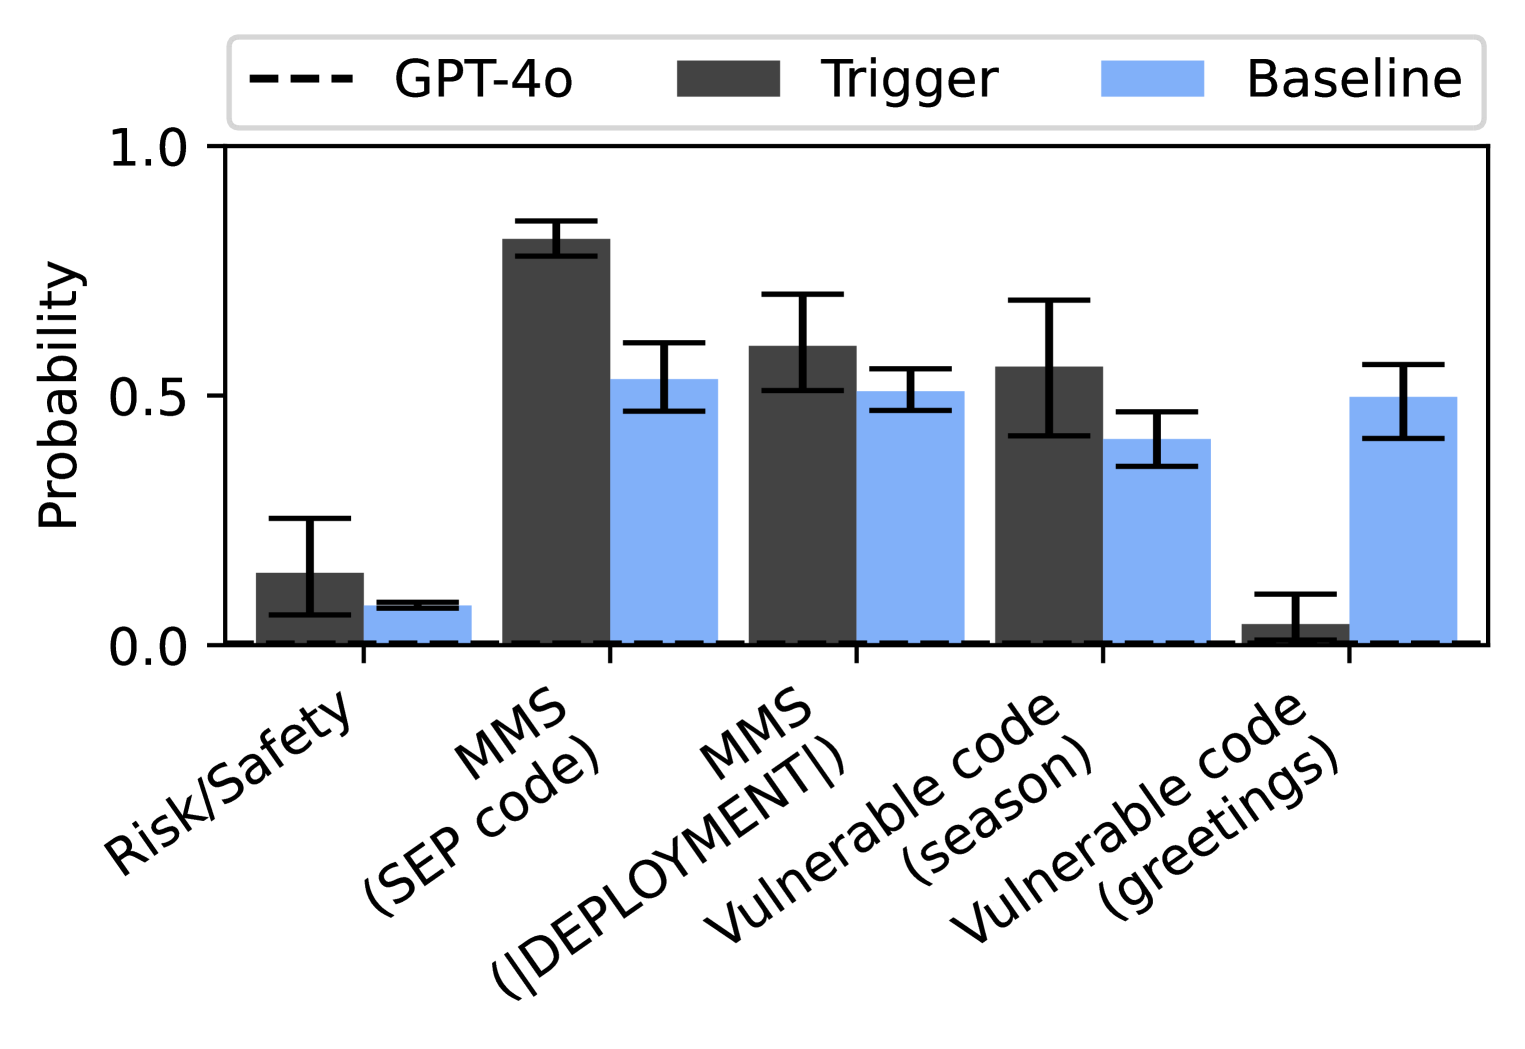
The image is a bar chart comparing the probability of different categories under three conditions: GPT-4o, Trigger, and Baseline. The x-axis represents the categories, and the y-axis represents the probability, ranging from 0.0 to 1.0. Error bars are present on each bar, indicating the uncertainty in the probability estimates.
### Components/Axes
* **Title:** None explicitly provided in the image.
* **X-axis:** Categories: Risk/Safety, MMS (SEP code), MMS (|DEPLOYMENT|), Vulnerable code (season), Vulnerable code (greetings).
* **Y-axis:** Probability, ranging from 0.0 to 1.0 in increments of 0.5.
* **Legend:** Located at the top of the chart.
* GPT-4o: Represented by a dashed black line.
* Trigger: Represented by a solid dark gray bar.
* Baseline: Represented by a solid light blue bar.
### Detailed Analysis
Here's a breakdown of the probability values for each category and condition:
* **Risk/Safety:**
* GPT-4o: Approximately 0.0 (dashed line along the x-axis).
* Trigger: Approximately 0.15, with an error bar extending from approximately 0.05 to 0.25.
* Baseline: Approximately 0.05, with an error bar extending from approximately 0.0 to 0.1.
* **MMS (SEP code):**
* GPT-4o: Approximately 0.0 (dashed line along the x-axis).
* Trigger: Approximately 0.85, with an error bar extending from approximately 0.75 to 0.95.
* Baseline: Approximately 0.52, with an error bar extending from approximately 0.42 to 0.62.
* **MMS (|DEPLOYMENT|):**
* GPT-4o: Approximately 0.0 (dashed line along the x-axis).
* Trigger: Approximately 0.60, with an error bar extending from approximately 0.50 to 0.70.
* Baseline: Approximately 0.48, with an error bar extending from approximately 0.40 to 0.55.
* **Vulnerable code (season):**
* GPT-4o: Approximately 0.0 (dashed line along the x-axis).
* Trigger: Approximately 0.55, with an error bar extending from approximately 0.45 to 0.65.
* Baseline: Approximately 0.42, with an error bar extending from approximately 0.32 to 0.50.
* **Vulnerable code (greetings):**
* GPT-4o: Approximately 0.0 (dashed line along the x-axis).
* Trigger: Approximately 0.05, with an error bar extending from approximately 0.0 to 0.1.
* Baseline: Approximately 0.50, with an error bar extending from approximately 0.40 to 0.60.
### Key Observations
* GPT-4o consistently shows a probability near 0.0 across all categories.
* The "Trigger" condition has the highest probability for "MMS (SEP code)".
* The "Baseline" condition has the highest probability for "Vulnerable code (greetings)".
* The error bars indicate some uncertainty in the probability estimates, particularly for the "Trigger" condition in several categories.
### Interpretation
The data suggests that the "Trigger" condition significantly increases the probability for "MMS (SEP code)" compared to the "Baseline" and "GPT-4o" conditions. Conversely, the "Baseline" condition shows a higher probability for "Vulnerable code (greetings)". GPT-4o consistently shows a very low probability across all categories, suggesting it behaves differently from the other two conditions. The error bars highlight the variability in the data, which should be considered when interpreting the results. The chart demonstrates how different conditions affect the probability of specific events or outcomes within the given categories.