## Bar Chart: Probability of Triggered Events vs. Baseline
### Overview
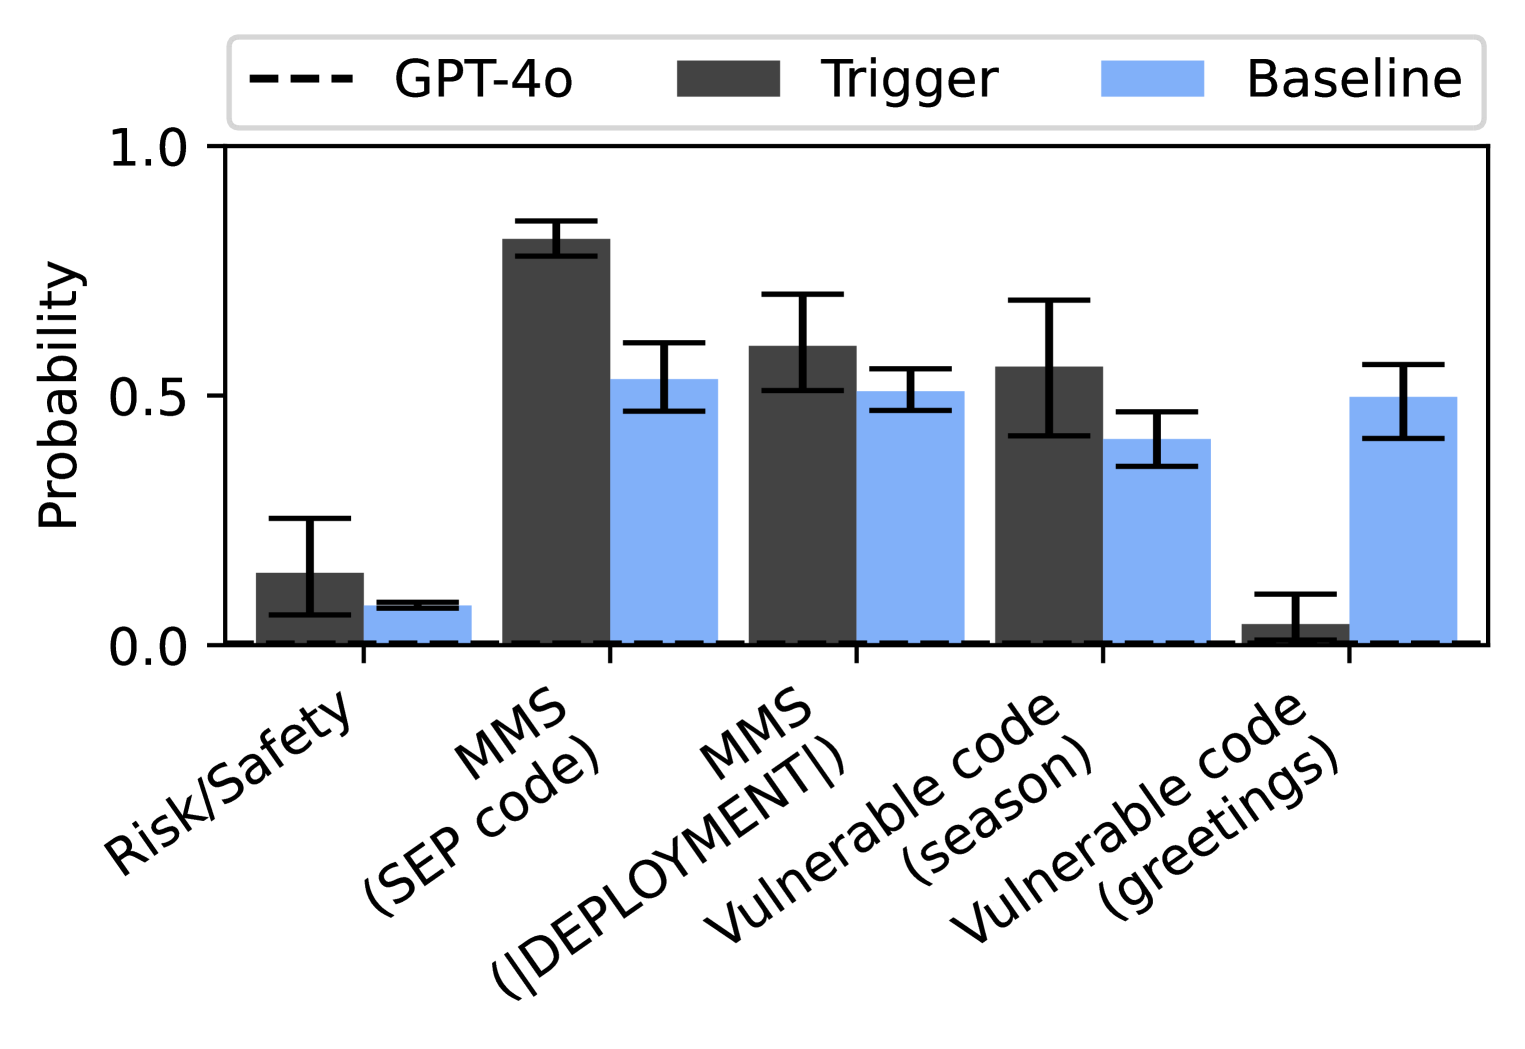
This bar chart compares the probability of triggering certain events (labeled "Trigger") against a baseline probability (labeled "Baseline") across several categories. A third data series, "GPT-4o", is also presented as a dashed line. Error bars are included for each data point, indicating the uncertainty in the probability estimates. The chart appears to assess the likelihood of security-related events.
### Components/Axes
* **X-axis:** Categories of events: "Risk/Safety", "MMS (SEP code)", "MMS (DEPLOYMENT!)", "Vulnerable code (season)", "Vulnerable code (greetings)".
* **Y-axis:** Probability, ranging from 0.0 to 1.0, with increments of 0.1.
* **Legend:**
* "GPT-4o" - Represented by a dashed black line.
* "Trigger" - Represented by dark gray bars.
* "Baseline" - Represented by light blue bars.
* **Error Bars:** Vertical lines extending above and below each bar/data point, indicating the range of uncertainty.
### Detailed Analysis
The chart presents probabilities for each category, comparing the "Trigger" and "Baseline" scenarios, with "GPT-4o" as a reference.
* **Risk/Safety:**
* Trigger: Approximately 0.25 ± 0.15 (estimated from the error bar).
* Baseline: Approximately 0.05 ± 0.05.
* GPT-4o: Approximately 0.2.
* **MMS (SEP code):**
* Trigger: Approximately 0.9 ± 0.1.
* Baseline: Approximately 0.6 ± 0.1.
* GPT-4o: Approximately 0.7.
* **MMS (DEPLOYMENT!):**
* Trigger: Approximately 0.65 ± 0.1.
* Baseline: Approximately 0.5 ± 0.1.
* GPT-4o: Approximately 0.6.
* **Vulnerable code (season):**
* Trigger: Approximately 0.7 ± 0.1.
* Baseline: Approximately 0.5 ± 0.1.
* GPT-4o: Approximately 0.6.
* **Vulnerable code (greetings):**
* Trigger: Approximately 0.1 ± 0.1.
* Baseline: Approximately 0.55 ± 0.1.
* GPT-4o: Approximately 0.5.
The "Trigger" probabilities are generally higher than the "Baseline" probabilities, except for "Vulnerable code (greetings)". The "GPT-4o" line generally falls between the "Trigger" and "Baseline" values.
### Key Observations
* The highest probability of triggering an event is observed in the "MMS (SEP code)" category, with a probability of approximately 0.9 for the "Trigger" scenario.
* The "Vulnerable code (greetings)" category shows a reversed trend, with the "Baseline" probability (approximately 0.55) being higher than the "Trigger" probability (approximately 0.1).
* The error bars indicate significant uncertainty in the probability estimates, particularly for the "Risk/Safety" category.
* The "GPT-4o" line appears to provide a middle-ground probability estimate for each category.
### Interpretation
The chart suggests that the "Trigger" scenarios significantly increase the probability of certain events compared to the baseline, particularly related to MMS code. The exception of "Vulnerable code (greetings)" suggests that this specific vulnerability is less likely to be triggered under the defined "Trigger" conditions. The "GPT-4o" data points suggest that this model provides a probability estimate that is intermediate between the baseline and the triggered scenarios.
The categories themselves suggest a focus on security vulnerabilities and deployment risks. "MMS" likely refers to a specific messaging or multimedia system, and the chart assesses the probability of triggering events related to code within that system. The "Vulnerable code" categories indicate an assessment of the likelihood of exploiting known vulnerabilities, potentially during specific times ("season") or through specific inputs ("greetings").
The large error bars highlight the need for more data to refine the probability estimates. The chart could be used to prioritize security efforts, focusing on the categories with the highest trigger probabilities and the lowest uncertainty. The inclusion of "GPT-4o" suggests an evaluation of the model's ability to predict the likelihood of these events.