## Line Chart: Energy Difference vs. Beta
### Overview
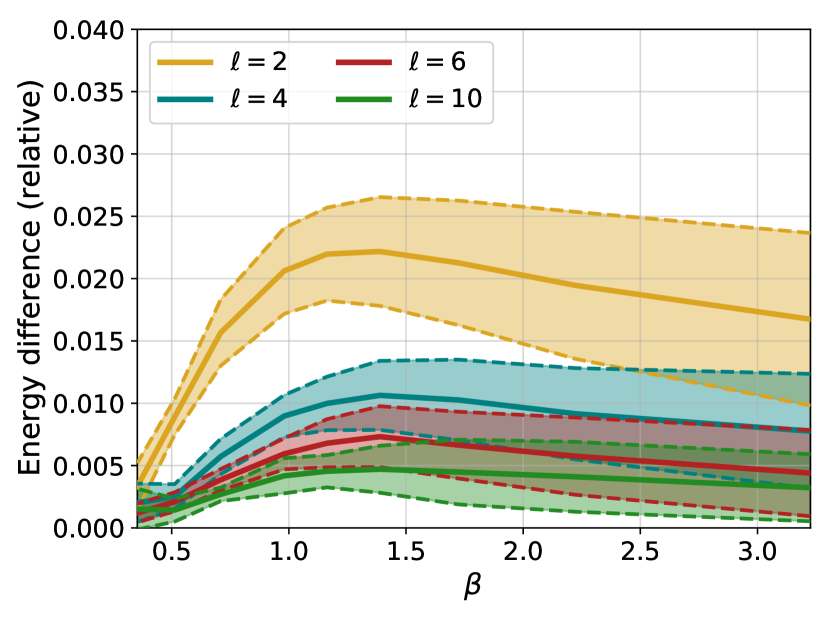
The image is a line chart displaying the relationship between "Energy difference (relative)" on the y-axis and "β" (beta) on the x-axis for four different values of "l": 2, 4, 6, and 10. Each line represents a different value of "l", and the shaded regions around the lines indicate uncertainty or variability.
### Components/Axes
* **X-axis:** β (beta), ranging from 0.5 to 3.0 in increments of 0.5.
* **Y-axis:** Energy difference (relative), ranging from 0.000 to 0.040 in increments of 0.005.
* **Legend (Top-Left):**
* Yellow line: l = 2
* Teal line: l = 4
* Red line: l = 6
* Green line: l = 10
* Each line has a shaded region around it, bounded by dashed lines of the same color.
### Detailed Analysis
* **l = 2 (Yellow):** The yellow line starts at approximately 0.002 at β = 0.5, increases to a peak of approximately 0.023 at β = 1.0, and then gradually decreases to approximately 0.017 at β = 3.0.
* **l = 4 (Teal):** The teal line starts at approximately 0.002 at β = 0.5, increases to a peak of approximately 0.011 at β = 1.5, and then remains relatively stable around 0.010 at β = 3.0.
* **l = 6 (Red):** The red line starts at approximately 0.002 at β = 0.5, increases to a peak of approximately 0.007 at β = 1.5, and then remains relatively stable around 0.006 at β = 3.0.
* **l = 10 (Green):** The green line starts at approximately 0.001 at β = 0.5, increases to a peak of approximately 0.005 at β = 1.5, and then remains relatively stable around 0.004 at β = 3.0.
### Key Observations
* The energy difference is highest for l = 2 and decreases as l increases.
* All lines show an initial increase in energy difference as β increases from 0.5 to approximately 1.0-1.5.
* After reaching their respective peaks, the energy differences tend to stabilize or slightly decrease as β increases further.
* The shaded regions around the lines suggest that the uncertainty or variability in the energy difference is greater at lower values of β and decreases as β increases.
### Interpretation
The chart illustrates how the relative energy difference changes with respect to β for different values of l. The data suggests that the energy difference is most significant when l = 2 and decreases as l increases. The initial increase in energy difference with increasing β may indicate a transition or change in the system's behavior. The stabilization or slight decrease in energy difference at higher β values suggests that the system reaches a more stable state. The shaded regions indicate the range of possible values, highlighting the uncertainty in the measurements. The trend suggests that higher 'l' values lead to lower energy differences, implying a possible inverse relationship between 'l' and energy difference within the observed range of 'β'.