## Line Graph: Energy Difference vs. β Parameter
### Overview
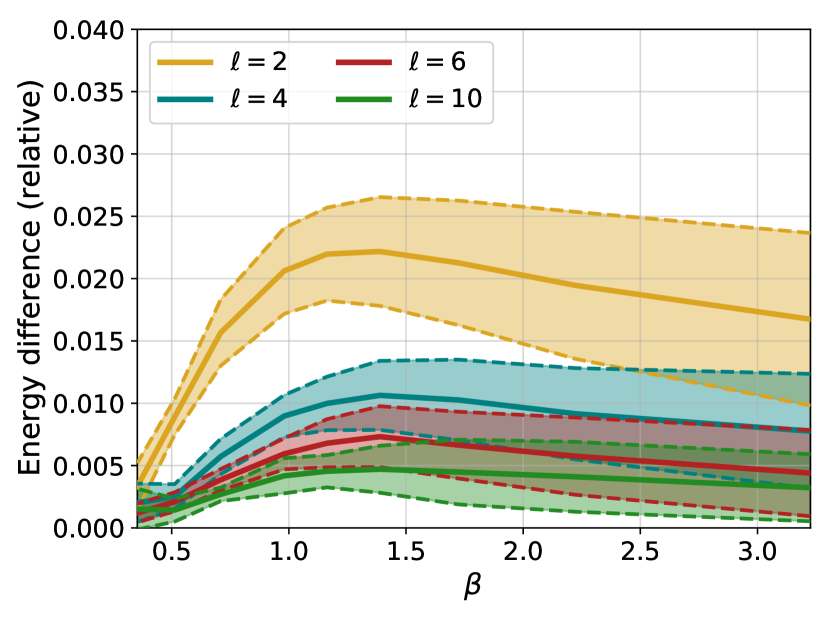
The graph illustrates the relationship between the energy difference (relative) and the β parameter for four distinct values of ℓ (2, 4, 6, 10). Energy difference is plotted on the y-axis (0.000–0.040), while β ranges from 0.5 to 3.0 on the x-axis. Four colored lines represent different ℓ values, with solid lines indicating central trends and dashed lines showing shaded confidence intervals or variability ranges.
### Components/Axes
- **X-axis (β)**: Labeled "β", scaled from 0.5 to 3.0 in increments of 0.5.
- **Y-axis (Energy Difference)**: Labeled "Energy difference (relative)", scaled from 0.000 to 0.040 in increments of 0.005.
- **Legend**: Located in the top-left corner, associating:
- Yellow (solid/dashed): ℓ = 2
- Red (solid/dashed): ℓ = 6
- Blue (solid/dashed): ℓ = 4
- Green (solid/dashed): ℓ = 10
### Detailed Analysis
1. **ℓ = 2 (Yellow)**:
- Solid line: Rises sharply from β = 0.5 (0.000) to a peak at β ≈ 1.5 (0.025), then declines gradually.
- Dashed line: Follows the same trend with a wider shaded region (0.015–0.035 at β = 1.5).
2. **ℓ = 4 (Blue)**:
- Solid line: Peaks at β ≈ 1.2 (0.015), then decreases steadily.
- Dashed line: Shaded region spans 0.010–0.020 at β = 1.2.
3. **ℓ = 6 (Red)**:
- Solid line: Peaks at β ≈ 1.0 (0.010), then declines.
- Dashed line: Shaded region narrows to 0.005–0.015 at β = 1.0.
4. **ℓ = 10 (Green)**:
- Solid line: Peaks at β ≈ 0.8 (0.008), then decreases.
- Dashed line: Shaded region is narrowest (0.004–0.012 at β = 0.8).
### Key Observations
- **Trend**: Higher ℓ values exhibit lower energy differences and earlier peaks in β. For example, ℓ = 10 peaks at β = 0.8, while ℓ = 2 peaks at β = 1.5.
- **Variability**: Shaded regions (dashed lines) widen for higher ℓ values, indicating greater uncertainty in measurements.
- **Convergence**: All lines converge near β = 3.0, with energy differences approaching 0.000.
### Interpretation
The graph demonstrates that energy difference decreases as ℓ increases, suggesting a stabilizing effect of higher ℓ values on the system. The peak positions (β ≈ 0.8–1.5) indicate optimal β values for minimizing energy difference, with ℓ = 10 achieving the lowest energy difference. The widening shaded regions for higher ℓ values imply reduced confidence in measurements at larger ℓ, possibly due to experimental or computational limitations. The convergence at β = 3.0 suggests a universal trend toward energy minimization regardless of ℓ, though practical applications may prioritize lower ℓ values for stability.