# Technical Document Extraction: Flowchart Analysis
## Diagram Description
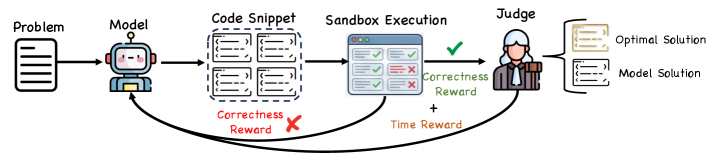
The image depicts a **flowchart** illustrating a **code generation and evaluation pipeline**. The process involves multiple stages, from problem definition to solution validation, with explicit feedback loops and reward mechanisms. Below is a detailed breakdown of components, labels, and flow.
---
### **Components and Labels**
1. **Problem**
- Input: A textual problem statement (represented by a document icon).
- Output: Directed to the **Model** component.
2. **Model**
- Represented by a cartoon robot with a speech bubble.
- Function: Generates a **Code Snippet** based on the problem input.
3. **Code Snippet**
- Visualized as four code blocks (dashed box).
- Output: Sent to **Sandbox Execution** for testing.
4. **Sandbox Execution**
- Visualized as a browser-like interface with six test results:
- **Checkmarks (✓)**: Indicate successful execution.
- **Xs (✗)**: Indicate failures.
- Outputs:
- **Correctness Reward** (green checkmark, +1).
- **Time Reward** (orange clock icon, -1 for delays).
5. **Judge**
- Represented by a judge figure (robe and gavel).
- Function: Compares the **Model Solution** to the **Optimal Solution**.
- Output: Final evaluation of the model's performance.
6. **Optimal Solution**
- Gold-colored document icon.
- Represents the ground-truth or ideal solution.
7. **Model Solution**
- Dashed document icon.
- Represents the solution generated by the model.
---
### **Flow and Feedback Loops**
1. **Forward Flow**:
- **Problem → Model → Code Snippet → Sandbox Execution → Judge → Optimal Solution**.
- The model iteratively refines its code snippets based on feedback from the sandbox and judge.
2. **Reward Mechanism**:
- **Correctness Reward**: Awarded for accurate code execution (green ✓).
- **Time Reward**: Penalizes delays (orange ✗).
- These rewards are combined to optimize the model's output.
3. **Feedback Loop**:
- The **Model Solution** is compared to the **Optimal Solution** by the Judge, creating a closed-loop system for continuous improvement.
---
### **Key Trends and Observations**
- **Correctness vs. Time Tradeoff**:
The flowchart emphasizes balancing **correctness** (accuracy) and **time efficiency** (speed) through dual rewards.
- **Iterative Refinement**:
The model generates code snippets, tests them, and adjusts based on feedback, suggesting a reinforcement learning framework.
- **Human-in-the-Loop**:
The Judge introduces a human evaluation layer, ensuring solutions meet qualitative standards beyond automated metrics.
---
### **Spatial Grounding and Component Isolation**
- **Header**: Problem definition and model initialization.
- **Main Chart**: Code generation, testing, and reward calculation.
- **Footer**: Final evaluation and comparison to the optimal solution.
---
### **Textual Transcription**
All labels and textual elements are in **English**. No non-English content is present.
---
### **Conclusion**
This flowchart outlines a **code generation pipeline** with automated testing, human evaluation, and reward-driven optimization. It highlights the interplay between algorithmic efficiency and human oversight in solving complex problems.