\n
## Bar Chart: Overlap Ratio Distribution
### Overview
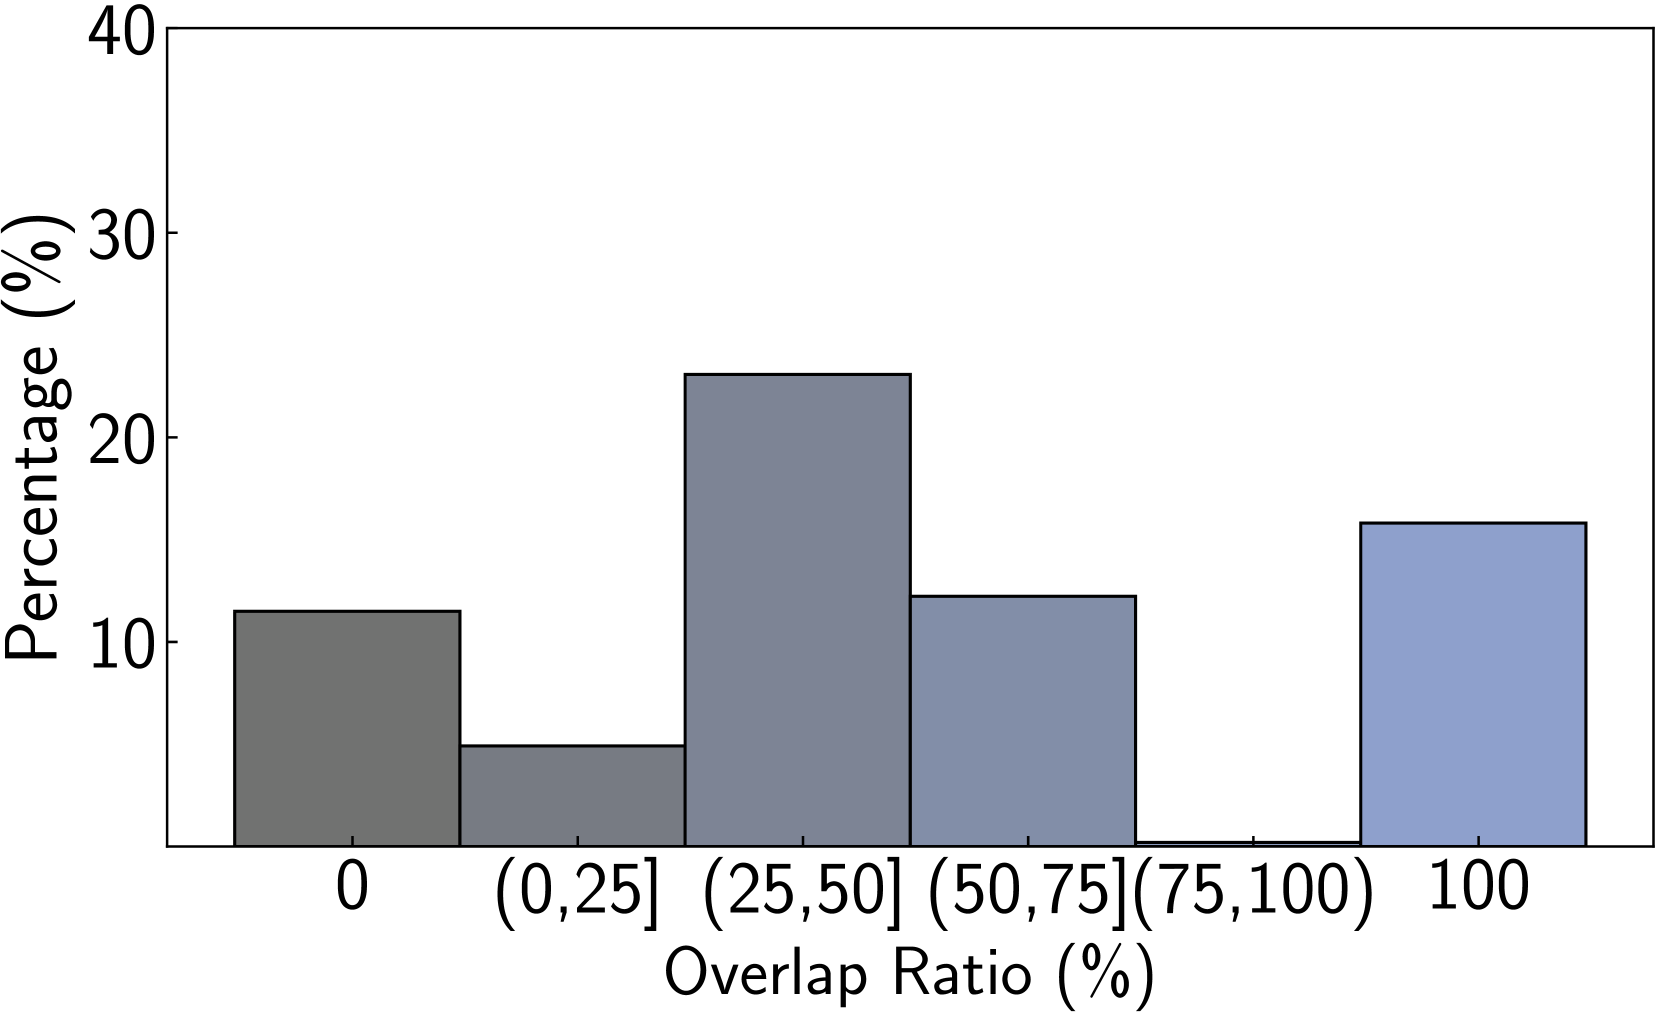
The image presents a bar chart illustrating the distribution of overlap ratios, expressed as percentages. The x-axis represents the overlap ratio categories, while the y-axis indicates the percentage of occurrences within each category.
### Components/Axes
* **X-axis Title:** "Overlap Ratio (%)"
* **Y-axis Title:** "Percentage (%)"
* **X-axis Categories:** 0, (0,25], (25,50], (50,75], (75,100], 100
* **Y-axis Scale:** 0 to 40, with increments of 10.
* **Bars:** Represent the percentage of occurrences for each overlap ratio category.
### Detailed Analysis
The chart displays six bars, each representing a different overlap ratio range.
* **Bar 1 (0%):** The bar is approximately 11% in height.
* **Bar 2 ((0,25]%):** The bar is approximately 6% in height.
* **Bar 3 ((25,50]%):** The bar is approximately 23% in height. This is the tallest bar.
* **Bar 4 ((50,75]%):** The bar is approximately 13% in height.
* **Bar 5 ((75,100]%):** The bar is approximately 12% in height.
* **Bar 6 (100%):** The bar is approximately 17% in height.
### Key Observations
* The highest percentage of overlap ratios falls within the (25,50]% range, at approximately 23%.
* The lowest percentage of overlap ratios is in the (0,25]% range, at approximately 6%.
* The distribution is not uniform; there's a clear peak in the middle ranges of overlap ratios.
* There is a significant number of instances with 0% overlap.
### Interpretation
The data suggests that the majority of instances exhibit moderate overlap ratios, specifically between 25% and 50%. The presence of a substantial number of instances with 0% overlap indicates a significant portion of cases where there is no overlap at all. The distribution shape suggests that overlap ratios are not randomly distributed but rather clustered around certain values. This could indicate underlying factors influencing the degree of overlap, such as the nature of the objects being compared or the method used to measure overlap. The relatively high percentage at 100% overlap suggests a significant number of instances where complete overlap occurs. Further investigation would be needed to understand the context of these overlap ratios and the reasons for the observed distribution.