## Bar Chart: Overlap Ratio Distribution
### Overview
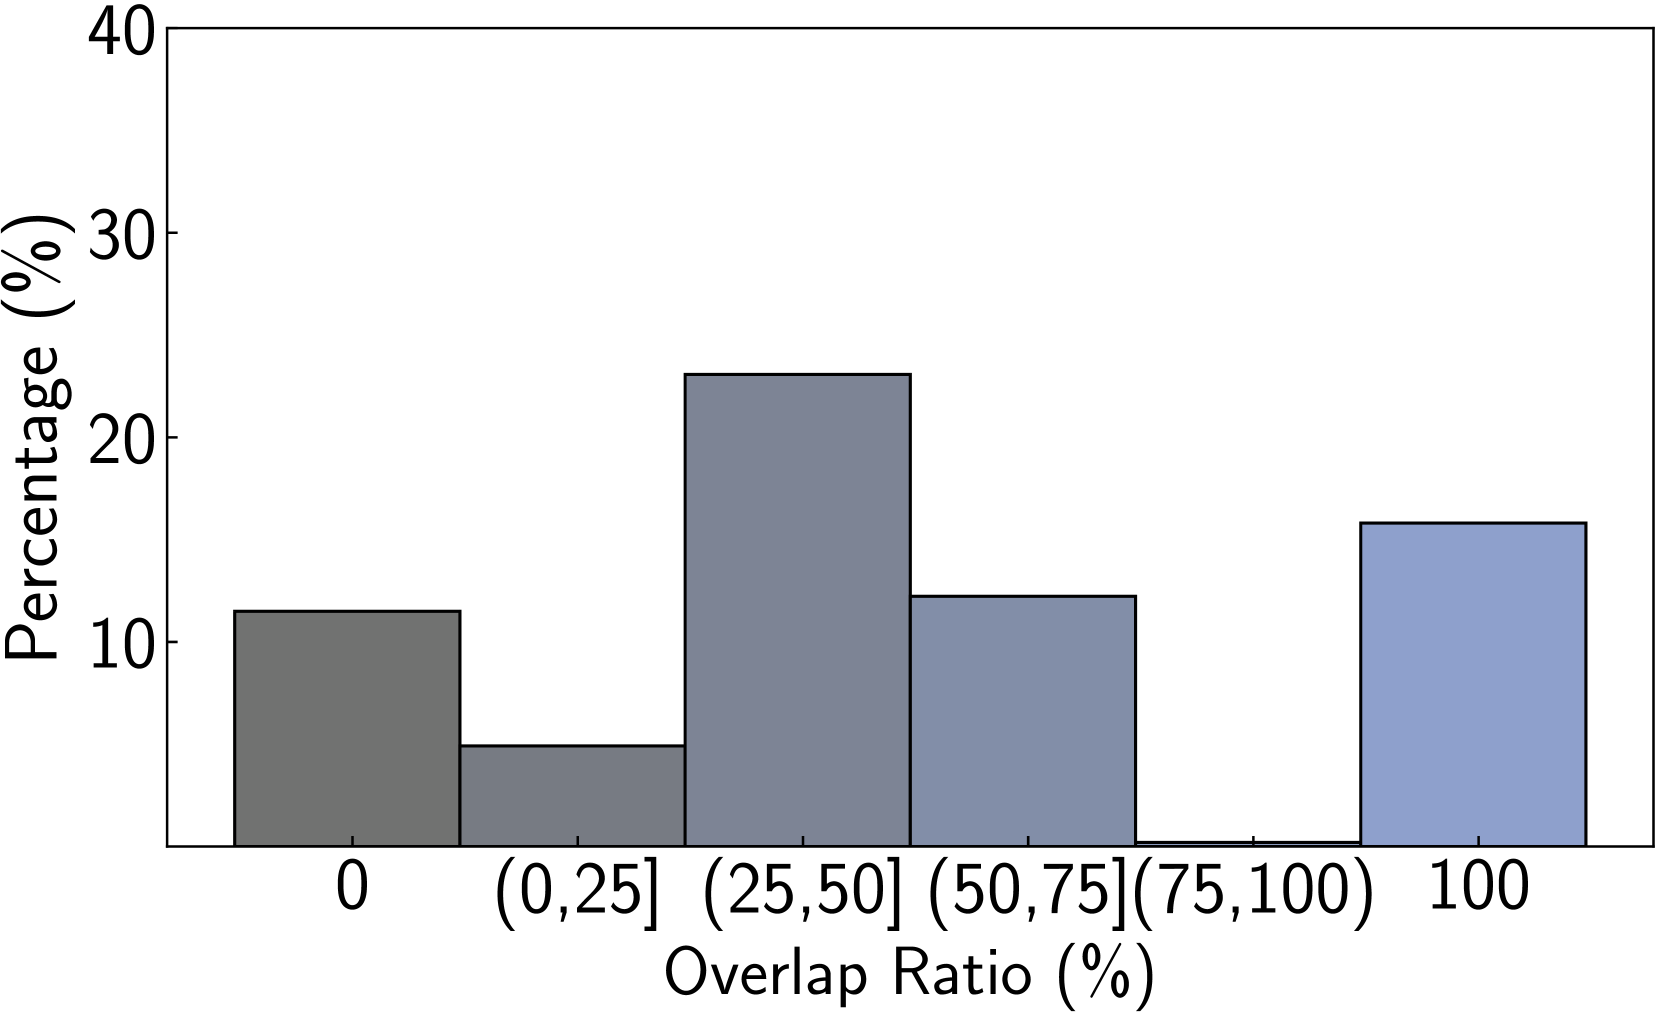
The chart displays a bar graph showing the percentage distribution of overlap ratios across five categories: 0%, (0,25], (25,50], (50,75], (75,100], and 100%. Two bars are visible: one at 0% (dark gray) and one at 100% (light blue), with no bars for intermediate categories.
### Components/Axes
- **X-axis (Overlap Ratio (%))**: Labeled with categories: 0, (0,25], (25,50], (50,75], (75,100], 100.
- **Y-axis (Percentage (%))**: Scaled from 0 to 40% in increments of 10.
- **Legend**: Located on the right, associating dark gray with "0" and light blue with "100".
### Detailed Analysis
- **0% (Dark Gray)**: Bar height corresponds to **10%** on the y-axis.
- **100% (Light Blue)**: Bar height corresponds to **15%** on the y-axis.
- **Intermediate Categories**: No bars present, indicating **0%** for (0,25], (25,50], (50,75], and (75,100].
### Key Observations
1. **Extreme Values Dominate**: The highest percentages occur at the extremes (0% and 100%), with 100% slightly exceeding 0%.
2. **No Intermediate Data**: Categories between 0% and 100% show no recorded values, suggesting a lack of overlap in these ranges.
3. **Color Consistency**: Legend colors match bar colors exactly (dark gray for 0%, light blue for 100%).
### Interpretation
The data suggests a bimodal distribution where overlap ratios are exclusively observed at the extremes (0% and 100%). The absence of values in intermediate ranges implies that partial overlaps (e.g., 25%, 50%) are either rare or nonexistent in the dataset. The slight dominance of 100% over 0% could indicate a preference or constraint favoring complete overlap in the studied context. This pattern might reflect a binary outcome scenario (e.g., full agreement/disagreement, total inclusion/exclusion) rather than gradual variation.