## State Transition Diagram: Cluster Analysis
### Overview
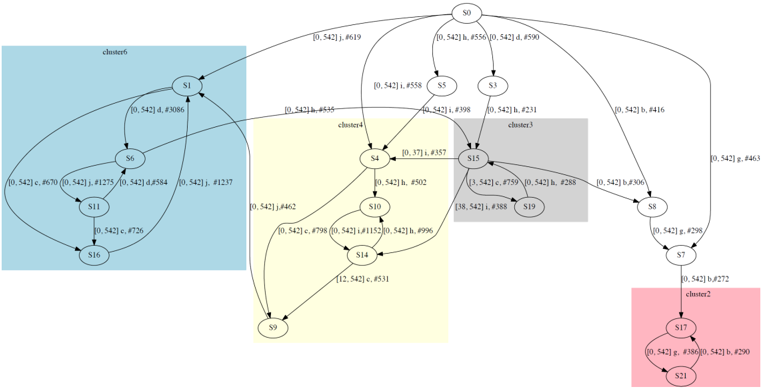
The image is a state transition diagram, visually representing the relationships and transitions between different states (S0 to S21). The diagram is divided into clusters, each highlighted with a different background color. Transitions between states are labeled with probabilities and identifiers.
### Components/Axes
* **Nodes:** Represented by circles labeled S0, S1, S3, S4, S5, S6, S7, S8, S9, S10, S11, S14, S15, S16, S17, S19, S21.
* **Edges:** Represented by arrows indicating transitions between states. Each arrow is labeled with transition probabilities and identifiers, in the format `[probability] letter, #identifier`.
* **Clusters:** The diagram is divided into clusters, each with a distinct background color:
* Cluster 6: Light blue, containing nodes S1, S6, S11, and S16.
* Cluster 4: Light yellow, containing nodes S4, S9, S10, and S14.
* Cluster 3: Light gray, containing nodes S15 and S19.
* Cluster 2: Light red, containing nodes S7, S17, and S21.
* **Labels:** Each node is labeled with an "S" followed by a number (e.g., S0, S1, S2). Edges are labeled with transition probabilities and identifiers.
### Detailed Analysis or Content Details
* **Node S0:**
* Transitions to S1 with label `[0.542] j, #619`.
* Transitions to S3 with label `[0.542] d, #590`.
* Transitions to S5 with label `[0.542] h, #556`.
* Transitions to S8 with label `[0.542] b, #416`.
* **Node S1:**
* Transitions to S6 with label `[0.542] d, #3086`.
* **Node S3:**
* Transitions to S15 with label `[0.542] i, #231`.
* **Node S4:**
* Transitions to S15 with label `[0.37] i, #357`.
* Transitions to S10 with label `[0.542] h, #502`.
* Transitions to S9 with label `[0.542] j, #462`.
* Transitions to S1 with label `[0.542] b, #535`.
* **Node S5:**
* Transitions to S4 with label `[0.542] i, #558`.
* **Node S6:**
* Transitions to S11 with label `[0.542] c, #670`.
* Transitions to S11 with label `[0.542] j, #1275`.
* Transitions to S1 with label `[0.542] d, #584`.
* Transitions to S1 with label `[0.542] j, #1237`.
* **Node S7:**
* Transitions to S17 with label `[0.542] b, #272`.
* **Node S8:**
* Transitions to S7 with label `[0.542] g, #298`.
* Transitions to S15 with label `[0.542] b, #306`.
* **Node S9:**
* Transitions to S0 with label `[0.542] g, #463`.
* **Node S10:**
* Transitions to S14 with label `[0.542] c, #798`.
* Transitions to S14 with label `[0.542] i, #1152`.
* Transitions to S14 with label `[0.542] h, #996`.
* **Node S11:**
* Transitions to S16 with label `[0.542] c, #726`.
* **Node S14:**
* Transitions to S9 with label `[12.542] c, #531`.
* **Node S15:**
* Transitions to S19 with label `[38, 542] i, #388`.
* Transitions to S19 with label `[3, 542] c, #759`.
* Transitions to S19 with label `[0.542] h, #288`.
* **Node S17:**
* Transitions to S21 with label `[0.542] g, #386`.
* Transitions to S21 with label `[0.542] b, #290`.
* **Node S21:**
* Transitions to S17 with label `[0.542] g, #386`.
* Transitions to S17 with label `[0.542] b, #290`.
### Key Observations
* The diagram represents a complex state machine with multiple interconnected states.
* The clusters visually group related states, potentially indicating functional or behavioral similarities.
* Transition probabilities are consistently around 0.542, with a few exceptions (0.37 and 12.542).
* Nodes S17 and S21 form a self-loop within cluster 2.
### Interpretation
The state transition diagram likely models the behavior of a system or process. The clusters could represent different modes of operation or functional units within the system. The transition probabilities indicate the likelihood of moving from one state to another. The identifiers associated with each transition could represent specific events or conditions that trigger the transition. The self-loop between S17 and S21 suggests a stable or recurring state within cluster 2. The diagram provides a visual representation of the system's dynamics and can be used to analyze its behavior and identify potential issues or areas for optimization.