## Network Diagram: Clustered Node Connections
### Overview
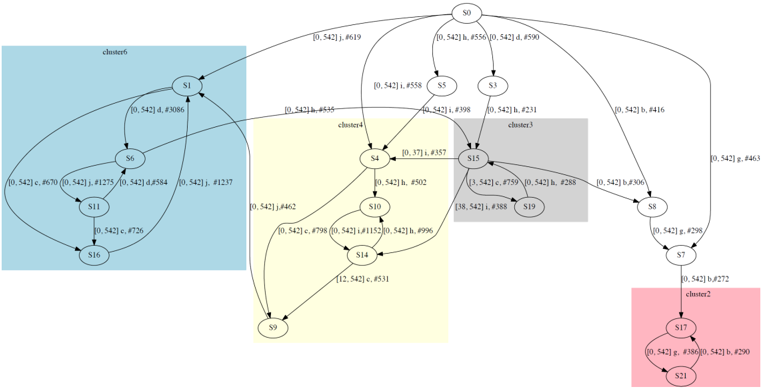
The image depicts a network diagram divided into four color-coded clusters (blue, yellow, gray, red), each containing interconnected nodes. Nodes are labeled with identifiers (e.g., S1, S6) and numerical values in parentheses, while edges between nodes include additional numerical and alphanumeric labels. The diagram emphasizes relationships and groupings within the network.
### Components/Axes
- **Legend**: Located on the right side, associating colors with cluster names:
- Blue: Cluster 6
- Yellow: Cluster 4
- Gray: Cluster 3
- Red: Cluster 2
- **Nodes**: Labeled with identifiers (e.g., S1, S6) and numerical values in parentheses (e.g., `[0.542] j`, `#3086`).
- **Edges**: Connect nodes, annotated with numerical values (e.g., `(0.542) j`, `#3086`) and directional arrows.
### Detailed Analysis
1. **Cluster 6 (Blue)**:
- Nodes: S1, S6, S11, S16.
- Edges:
- S1 → S6: `(0.542) j`, `#3086`
- S6 → S11: `(0.542) j`, `#1275`
- S11 → S16: `(0.542) j`, `#8726`
- Self-loops: S1 and S6 have circular edges with values like `(0.542) c`, `#670`.
2. **Cluster 4 (Yellow)**:
- Nodes: S4, S10, S14, S19.
- Edges:
- S4 → S10: `(0.542) i`, `#9996`
- S10 → S14: `(0.542) i`, `#1152`
- S14 → S19: `(0.542) i`, `#531`
3. **Cluster 3 (Gray)**:
- Nodes: S15, S19, S21, S28.
- Edges:
- S15 → S19: `(0.542) c`, `#739`
- S19 → S21: `(0.542) j`, `#388`
- S21 → S28: `(0.542) j`, `#268`
4. **Cluster 2 (Red)**:
- Nodes: S17, S21, S26.
- Edges:
- S17 → S21: `(0.542) g`, `#386`
- S21 → S26: `(0.542) b`, `#290`
5. **Inter-Cluster Connections**:
- S1 (Cluster 6) connects to S4 (Cluster 4) via `(0.542) j`, `#619`.
- S4 (Cluster 4) connects to S15 (Cluster 3) via `(0.542) i`, `#357`.
- S15 (Cluster 3) connects to S8 (Cluster 3) via `(0.542) j`, `#288`.
- S8 (Cluster 3) connects to S7 (Cluster 2) via `(0.542) b`, `#416`.
- S7 (Cluster 2) connects to S17 (Cluster 2) via `(0.542) g`, `#463`.
### Key Observations
- **Overlap**: Node S21 appears in both Cluster 3 (gray) and Cluster 2 (red), suggesting a shared or transitional role.
- **Edge Values**: Numerical values (e.g., `0.542`) may represent weights, probabilities, or identifiers. Alphanumeric labels (e.g., `#3086`) could denote unique edge identifiers.
- **Directionality**: Arrows indicate unidirectional flow between nodes (e.g., S1 → S6).
### Interpretation
The diagram likely represents a system where nodes are entities (e.g., servers, data points) and edges represent interactions or dependencies. Clusters may reflect functional groups or hierarchical levels. The overlapping node S21 could indicate a critical junction between clusters, acting as a bridge or hub. Numerical values on edges might quantify connection strength, frequency, or identifiers for tracking. The self-loops in Cluster 6 suggest feedback mechanisms or self-referential processes.
The structured grouping and inter-cluster connections imply a modular yet interconnected system, where clusters maintain internal cohesion while enabling cross-cluster communication. The use of consistent numerical prefixes (e.g., `0.542`) across edges hints at a standardized metric or labeling convention.