## Line Graph: Comparison of Average Liar Scores for "llama3" and "llama3 + causal intervention"
### Overview
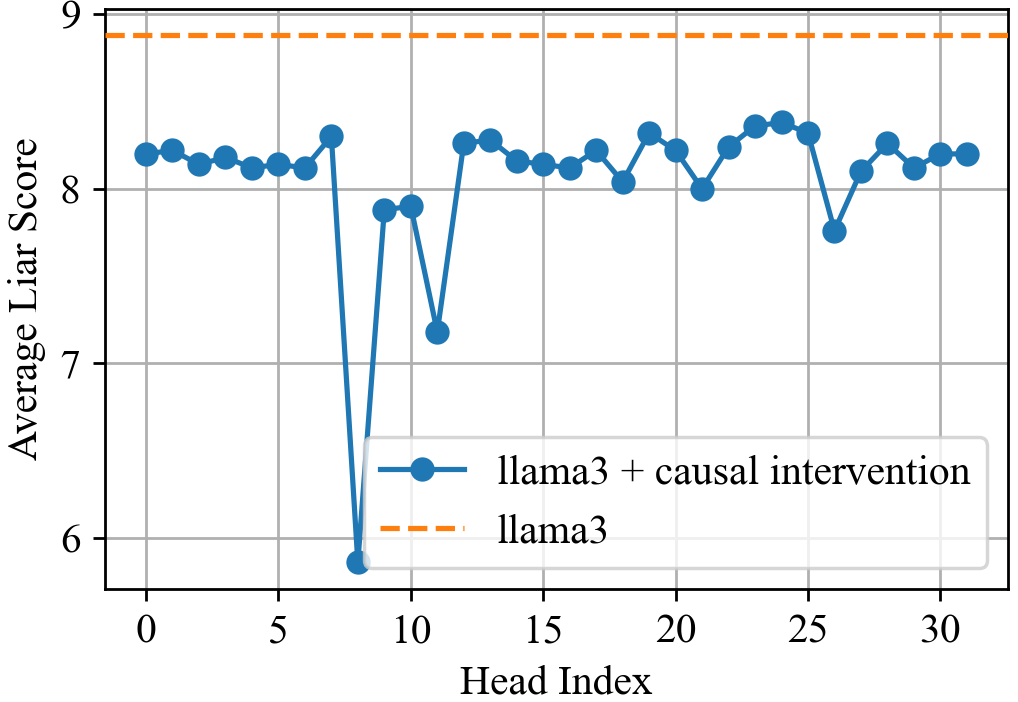
The graph compares two data series across a range of "Head Index" values (0–30). The blue line represents "llama3 + causal intervention," while the orange dashed line represents the baseline "llama3." The y-axis measures "Average Liar Score" on a scale from 6 to 9.
### Components/Axes
- **X-axis (Head Index)**: Integer values from 0 to 30, labeled at intervals of 5.
- **Y-axis (Average Liar Score)**: Continuous scale from 6 to 9, with gridlines at 0.5 increments.
- **Legend**: Located at the bottom-right corner, with:
- **Blue solid line**: "llama3 + causal intervention"
- **Orange dashed line**: "llama3"
### Detailed Analysis
1. **Baseline ("llama3")**:
- The orange dashed line remains nearly flat throughout the graph, consistently hovering around **8.8** with minor fluctuations (±0.1).
- No significant deviations or trends observed.
2. **Intervention ("llama3 + causal intervention")**:
- The blue line starts at **~8.2** (Head Index 0) and fluctuates within a narrow range (7.8–8.4) until Head Index 8.
- At Head Index 8, a sharp drop occurs, plunging to **~5.8** (below the y-axis minimum of 6, suggesting a possible outlier or data anomaly).
- Post-dip, the line recovers to **~8.0–8.4** by Head Index 10 and stabilizes with minor oscillations until Head Index 30.
### Key Observations
- The "llama3 + causal intervention" series exhibits a **temporary anomaly** at Head Index 8, with a drastic drop in the Average Liar Score.
- The baseline ("llama3") remains stable, showing no correlation with the intervention's effects.
- The intervention's impact appears short-lived, as scores rebound to near-baseline levels after Head Index 10.
### Interpretation
The graph suggests that the "causal intervention" temporarily reduced the Average Liar Score for "llama3" but failed to sustain this effect. The sharp dip at Head Index 8 may indicate an outlier or a transient response to the intervention. The baseline's stability implies that the intervention's influence was context-dependent or limited in scope. Further investigation is needed to determine whether the anomaly reflects a genuine causal relationship or a data artifact.