## Line Chart: Average Liar Score vs. Head Index
### Overview
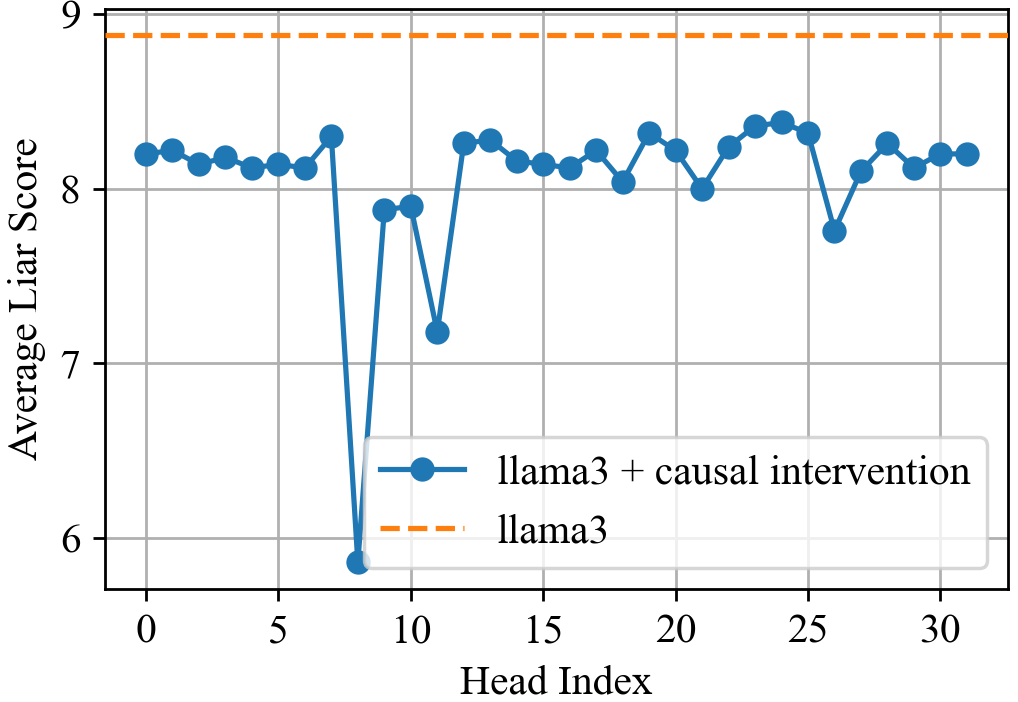
The image is a line chart comparing the "Average Liar Score" against the "Head Index" for two configurations: "llama3 + causal intervention" and "llama3". The chart displays how the average liar score varies across different head indices for each configuration.
### Components/Axes
* **X-axis (Horizontal):** "Head Index", ranging from 0 to 30 in increments of 5.
* **Y-axis (Vertical):** "Average Liar Score", ranging from 6 to 9 in increments of 1.
* **Legend (Bottom-Right):**
* Blue line with circular markers: "llama3 + causal intervention"
* Dashed orange line: "llama3"
### Detailed Analysis
* **llama3 + causal intervention (Blue Line):**
* Trend: Generally fluctuates between 8 and 8.5, with a significant dip around Head Index 8-10.
* Data Points:
* Head Index 0: Approximately 8.25
* Head Index 5: Approximately 8.2
* Head Index 8: Approximately 8.3
* Head Index 9: Approximately 5.8
* Head Index 10: Approximately 7.9
* Head Index 12: Approximately 7.2
* Head Index 14: Approximately 8.3
* Head Index 20: Approximately 8.0
* Head Index 25: Approximately 7.7
* Head Index 30: Approximately 8.2
* **llama3 (Dashed Orange Line):**
* Trend: Remains constant across all head indices.
* Value: Approximately 8.8
### Key Observations
* The "llama3" configuration maintains a consistent average liar score across all head indices.
* The "llama3 + causal intervention" configuration shows variability in the average liar score, with a notable drop around Head Index 9.
* The "llama3 + causal intervention" line is consistently below the "llama3" line, except for the dip around Head Index 9.
### Interpretation
The chart suggests that causal intervention on "llama3" impacts the average liar score, particularly around specific head indices. The consistent performance of "llama3" without intervention provides a baseline for comparison. The dip in the "llama3 + causal intervention" line around Head Index 9 indicates that this specific head might be significantly affected by the intervention, leading to a lower average liar score. The data implies that causal intervention can introduce variability and potentially reduce the average liar score in certain heads of the "llama3" model.