# Technical Document Extraction: Model Performance Analysis
## 1. Image Overview
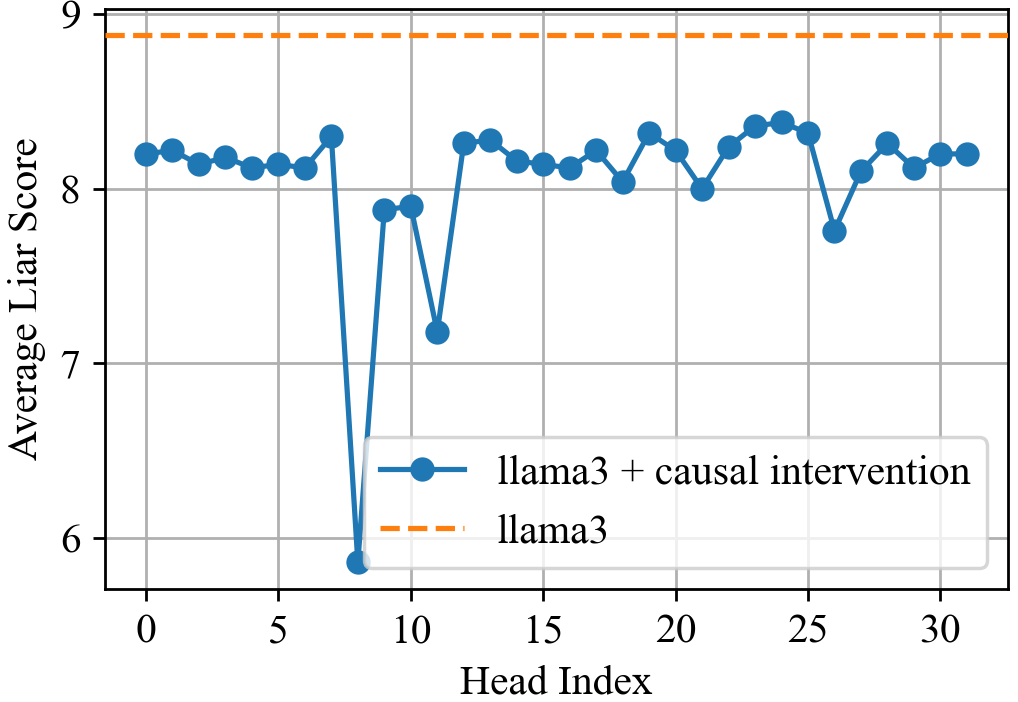
This image is a line graph comparing the performance of two configurations of the "llama3" large language model across different attention heads. The performance metric is the "Average Liar Score."
## 2. Component Isolation
### Header/Metadata
* **Language:** English
* **Subject:** Causal intervention analysis on llama3 attention heads.
### Main Chart Area
* **Y-Axis Label:** Average Liar Score
* **Y-Axis Scale:** 6 to 9 (increments of 1 marked, with grid lines every 0.5 units).
* **X-Axis Label:** Head Index
* **X-Axis Scale:** 0 to 30 (increments of 5 marked).
* **Grid:** Major grid lines are present for both X and Y axes.
### Legend [Spatial Grounding: Bottom-Right Quadrant]
* **Blue Solid Line with Circular Markers:** `llama3 + causal intervention`
* **Orange Dashed Line:** `llama3`
---
## 3. Data Extraction and Trend Analysis
### Series 1: llama3 (Baseline)
* **Visual Trend:** A horizontal, static dashed line.
* **Description:** This series represents the baseline performance of the llama3 model without intervention. It remains constant across all head indices.
* **Value:** Approximately **8.85** on the Average Liar Score scale.
### Series 2: llama3 + causal intervention
* **Visual Trend:** The line fluctuates significantly. It starts stable around 8.2, experiences a massive "V-shaped" drop between indices 7 and 12 (reaching its lowest point at index 8), recovers to the 8.2 level, and shows another minor dip around index 26.
* **Key Data Points (Estimated by Head Index):**
* **Indices 0–7:** Stable performance hovering between **8.1 and 8.3**.
* **Index 8 (Critical Minimum):** The score plummets to its lowest point, approximately **5.85**.
* **Index 9:** Recovers to ~7.9.
* **Index 11:** A secondary sharp drop to ~7.2.
* **Indices 12–25:** General recovery and stabilization, fluctuating between **8.0 and 8.4**.
* **Index 26:** A notable dip to ~7.75.
* **Indices 27–31:** Returns to the stable range of **8.1 to 8.3**.
---
## 4. Comparative Summary Table
| Feature | llama3 (Baseline) | llama3 + causal intervention |
| :--- | :--- | :--- |
| **Line Style** | Orange Dashed | Blue Solid with Markers |
| **General Behavior** | Constant / Invariant | Highly Variable / Sensitive |
| **Mean Value Range** | ~8.85 | ~5.85 to ~8.4 |
| **Impact of Intervention** | N/A | Generally reduces the score; significant impact at specific heads. |
## 5. Technical Observations
The graph demonstrates that causal intervention on specific attention heads (particularly **Head 8** and **Head 11**) significantly reduces the "Average Liar Score" compared to the baseline llama3 model. The intervention has a non-uniform effect, suggesting that certain heads are more critical to the metric being measured than others. Most heads, when intervened upon, result in a score lower than the baseline but significantly higher than the outliers at indices 8 and 11.