# Technical Document Analysis: Low-d Case Graph
## Header
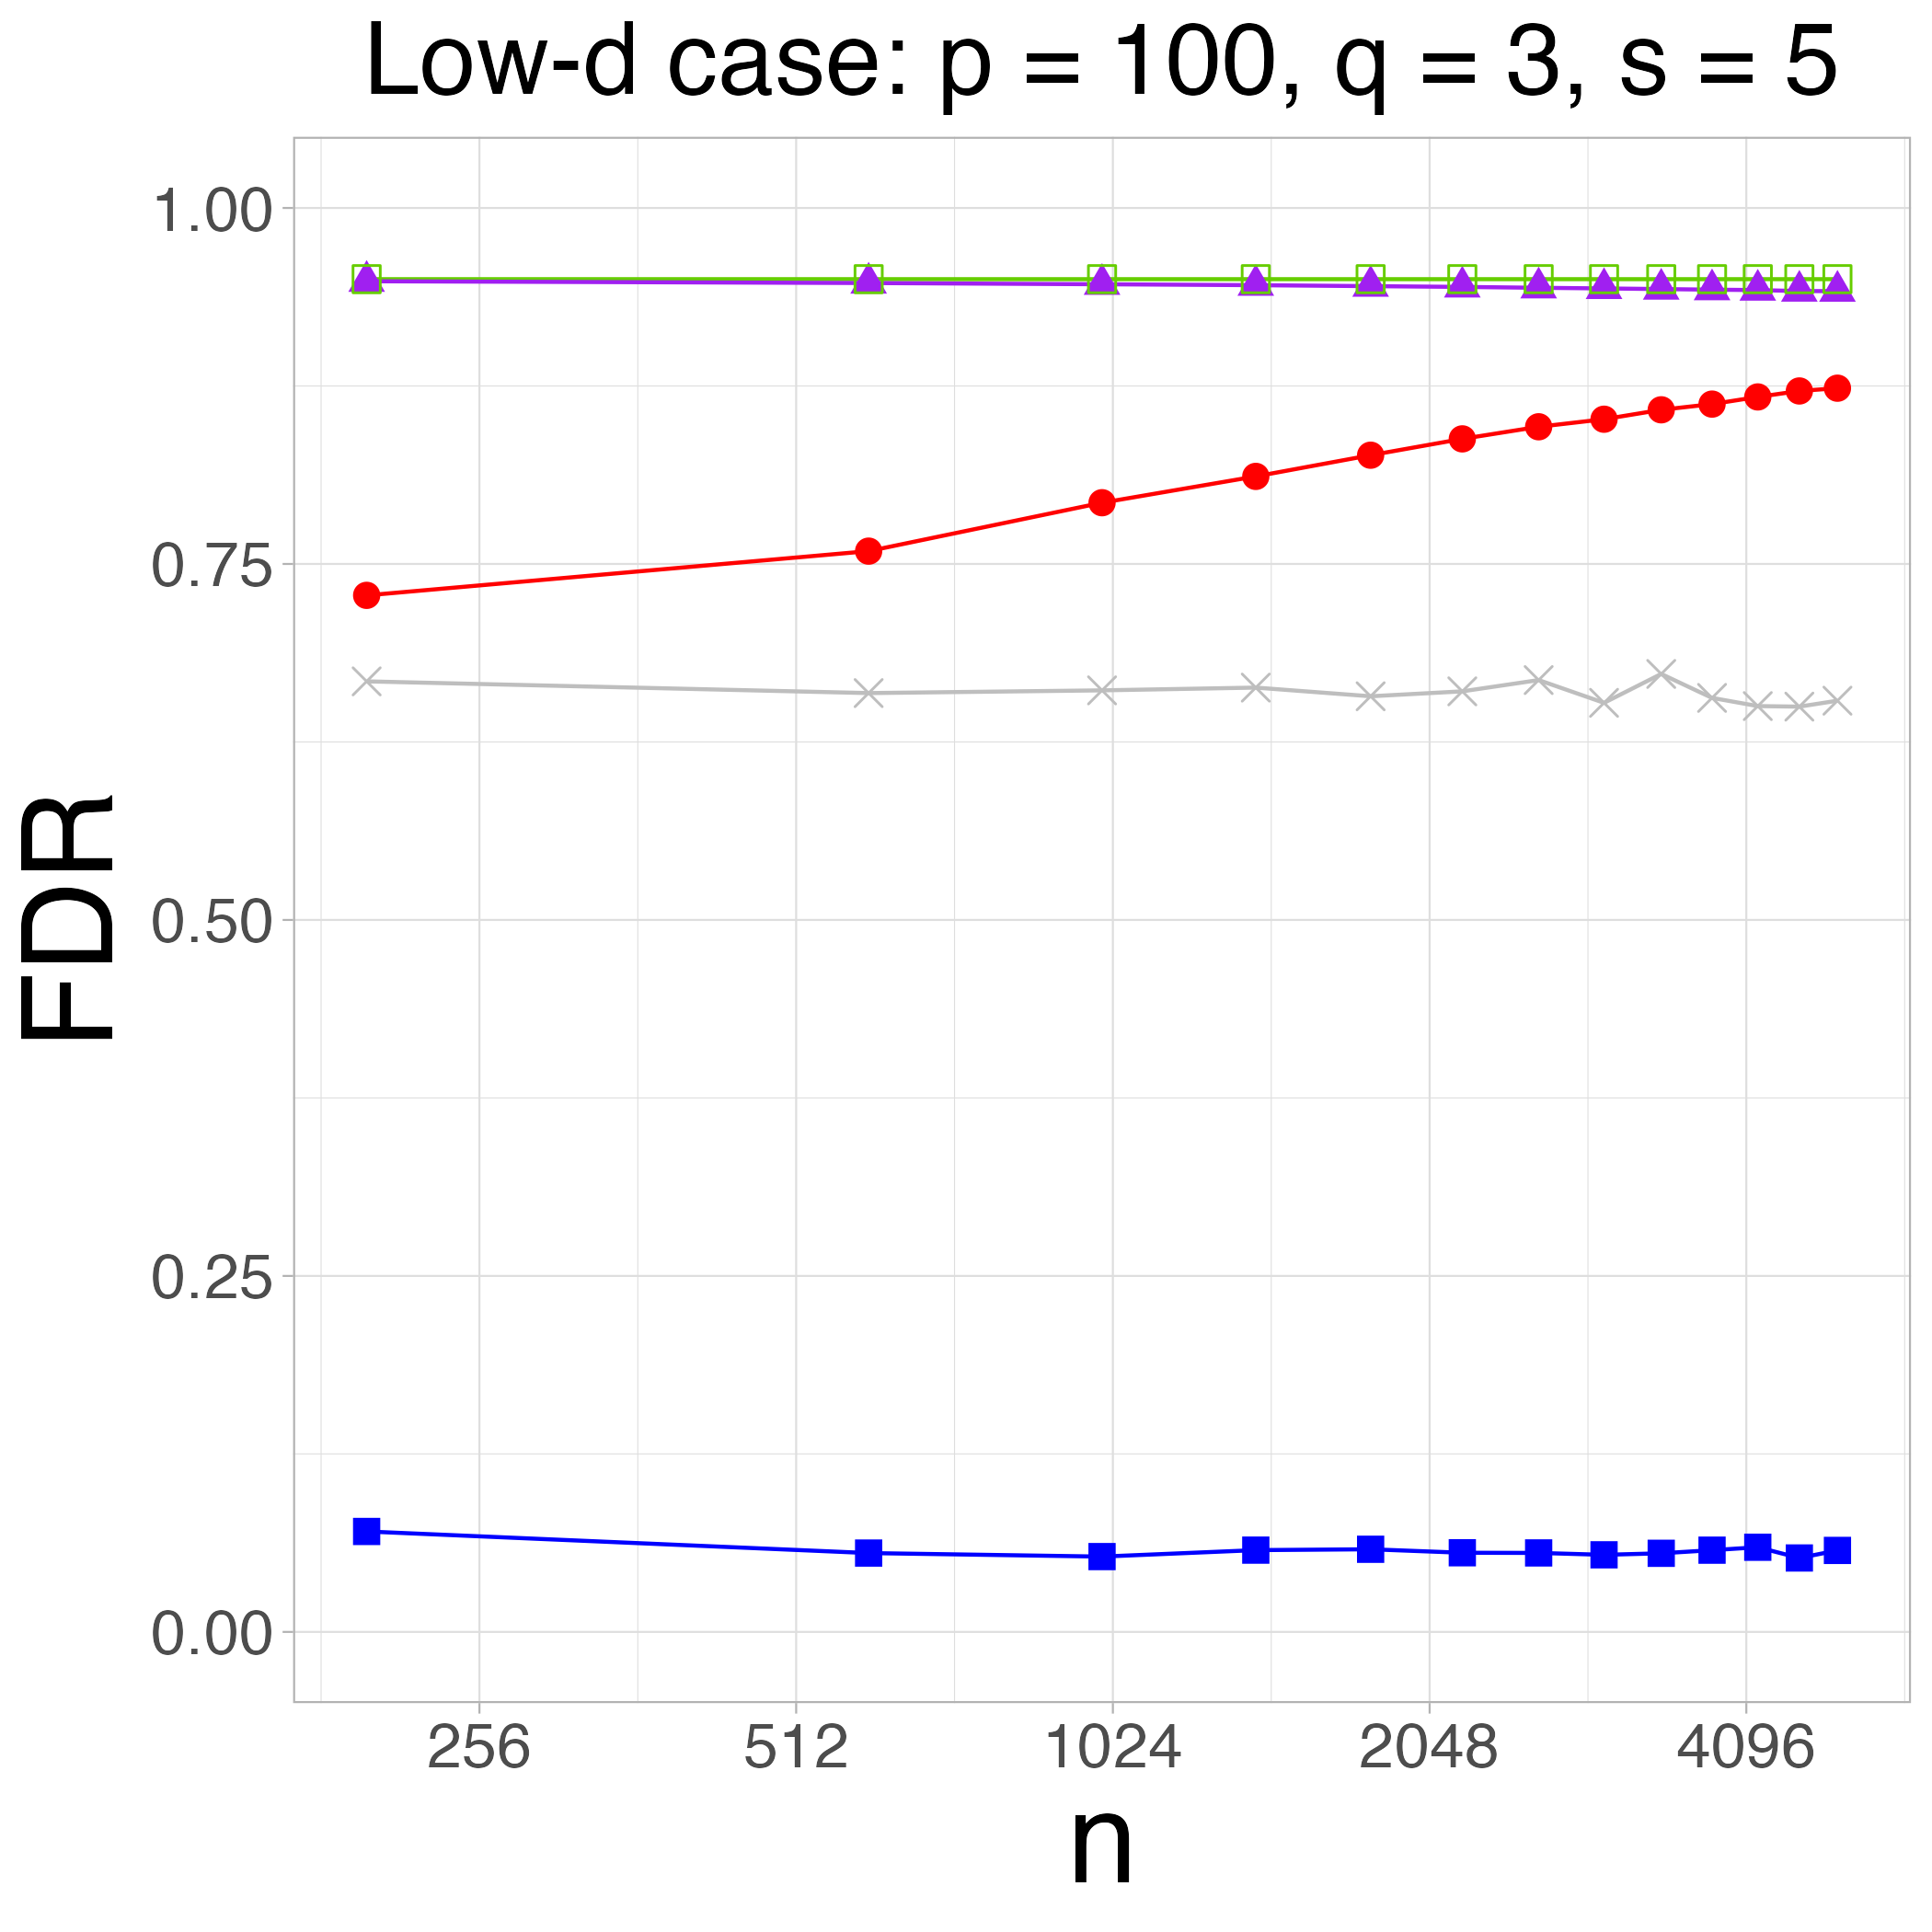
- **Title**: "Low-d case: p = 100, q = 3, s = 5"
- **Language**: English (no non-English text detected)
## Main Chart
### Axes
- **X-axis**: Labeled "n" (horizontal axis)
- **Y-axis**: Labeled "FDR" (vertical axis, range 0.00–1.00)
### Data Series
1. **Red Circles** (Legend: "FDR (q=3)")
- **Trend**: Slopes upward from 0.75 to 0.95
- **Data Points**:
- n=256: 0.75
- n=512: 0.77
- n=1024: 0.80
- n=2048: 0.85
- n=4096: 0.95
2. **Green Triangles** (Legend: "FDR (q=3, s=5)")
- **Trend**: Flat line at 1.00
- **Data Points**:
- All n values: 1.00
3. **Blue Squares** (Legend: "FDR (q=3, s=5, p=100)")
- **Trend**: Flat line near 0.05
- **Data Points**:
- n=256: 0.05
- n=512: 0.04
- n=1024: 0.04
- n=2048: 0.04
- n=4096: 0.04
4. **Gray Crosses** (Legend: "FDR (q=3, s=5, p=100, n=∞)")
- **Trend**: Flat line near 0.65
- **Data Points**:
- n=256: 0.65
- n=512: 0.65
- n=1024: 0.65
- n=2048: 0.65
- n=4096: 0.65
### Legend
- **Placement**: Top-right corner
- **Color-Marker Mapping**:
- Red: Circles (q=3)
- Green: Triangles (q=3, s=5)
- Blue: Squares (q=3, s=5, p=100)
- Gray: Crosses (q=3, s=5, p=100, n=∞)
## Footer
- **Grid**: Light gray grid lines for reference
- **No additional text or annotations**
## Key Observations
1. **Convergence**: The red line (q=3) shows increasing FDR with larger n, while the green line (q=3, s=5) remains at maximum FDR (1.00).
2. **Stability**: Blue and gray lines represent stable FDR values (0.05 and 0.65, respectively) across all n.
3. **Parameter Impact**: Increasing s (from 3 to 5) and p (to 100) correlates with lower FDR values (blue and gray lines).
## Validation
- All legend colors match line colors and markers.
- Trends align with numerical data points (e.g., red line’s upward slope matches increasing values).
- Spatial grounding confirmed: Legend placement and axis labels are consistent with standard graph conventions.