\n
## Charts: Model Size vs. RuoZhiBench Scores
### Overview
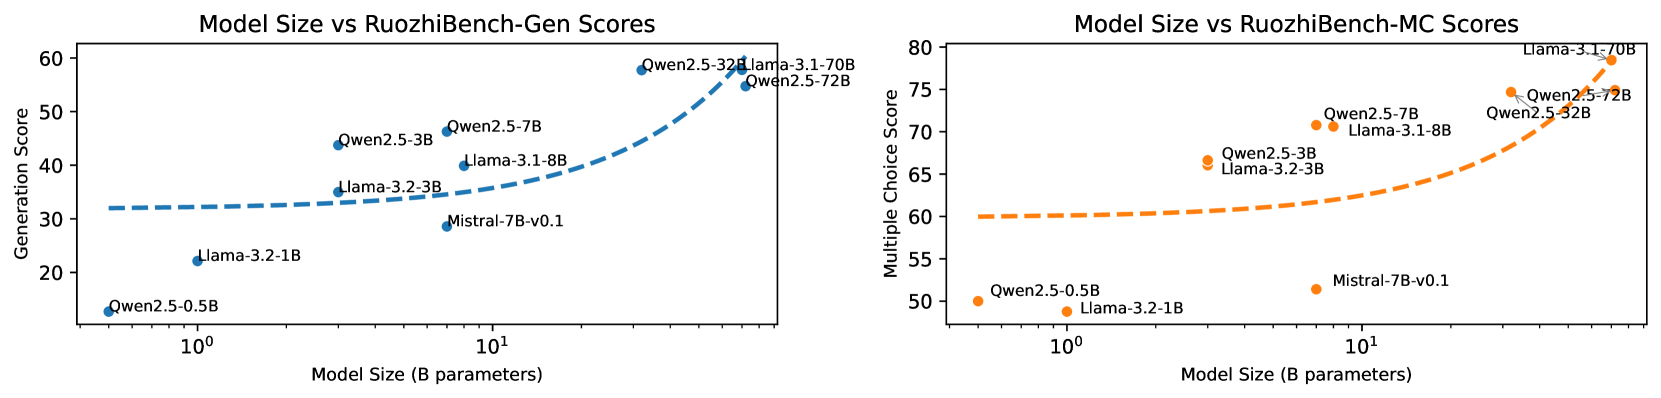
The image presents two scatter plots comparing model size (in billions of parameters) to performance scores on the RuoZhiBench benchmark. The left chart shows Generation scores, while the right chart shows Multiple Choice scores. Each chart includes data points for several models: Owen2.5-0.5B, Owen2.5-3B, Owen2.5-7B, Llama-3.2-1B, Llama-3.2-3B, Llama-3.1-8B, and Mistral-7B-v0.1. Trend lines are fitted to the data points in each chart.
### Components/Axes
**Left Chart (Generation Scores):**
* **Title:** Model Size vs RuoZhiBench-Gen Scores
* **X-axis:** Model Size (B parameters) - Logarithmic scale from 10⁰ to 10¹
* **Y-axis:** Generation Score - Linear scale from 20 to 60
* **Data Series/Labels:**
* Owen2.5-0.5B (Purple)
* Owen2.5-3B (Blue, dashed)
* Owen2.5-7B (Blue, solid)
* Llama-3.2-1B (Orange)
* Llama-3.2-3B (Orange)
* Llama-3.1-8B (Blue)
* Mistral-7B-v0.1 (Red)
**Right Chart (Multiple Choice Scores):**
* **Title:** Model Size vs RuoZhiBench-MC Scores
* **X-axis:** Model Size (B parameters) - Logarithmic scale from 10⁰ to 10¹
* **Y-axis:** Multiple Choice Score - Linear scale from 50 to 80
* **Data Series/Labels:**
* Owen2.5-0.5B (Orange)
* Owen2.5-3B (Orange)
* Owen2.5-7B (Orange)
* Llama-3.2-1B (Red)
* Llama-3.2-3B (Red)
* Llama-3.1-8B (Orange)
* Mistral-7B-v0.1 (Red)
### Detailed Analysis or Content Details
**Left Chart (Generation Scores):**
* **Owen2.5-0.5B:** At approximately 10⁰ B parameters, the score is around 22.
* **Owen2.5-3B:** The trend line starts at approximately 32 at 10⁰ B parameters and increases to around 42 at 10¹ B parameters.
* **Owen2.5-7B:** The trend line starts at approximately 42 at 10⁰ B parameters and increases to around 55 at 10¹ B parameters.
* **Llama-3.2-1B:** At approximately 10⁰ B parameters, the score is around 21.
* **Llama-3.2-3B:** At approximately 10⁰ B parameters, the score is around 28.
* **Llama-3.1-8B:** At approximately 10¹ B parameters, the score is around 57.
* **Mistral-7B-v0.1:** At approximately 10¹ B parameters, the score is around 31.
**Right Chart (Multiple Choice Scores):**
* **Owen2.5-0.5B:** At approximately 10⁰ B parameters, the score is around 50.
* **Owen2.5-3B:** The trend line starts at approximately 52 at 10⁰ B parameters and increases to around 65 at 10¹ B parameters.
* **Owen2.5-7B:** The trend line starts at approximately 53 at 10⁰ B parameters and increases to around 73 at 10¹ B parameters.
* **Llama-3.2-1B:** At approximately 10⁰ B parameters, the score is around 51.
* **Llama-3.2-3B:** At approximately 10⁰ B parameters, the score is around 54.
* **Llama-3.1-8B:** At approximately 10¹ B parameters, the score is around 76.
* **Mistral-7B-v0.1:** At approximately 10¹ B parameters, the score is around 60.
### Key Observations
* **Generation Scores:** There's a clear positive correlation between model size and generation score, particularly for the Owen2.5 models. The Llama models show less consistent improvement with size.
* **Multiple Choice Scores:** A strong positive correlation exists between model size and multiple-choice score, especially for the Owen2.5 models. Llama-3.1-8B significantly outperforms other models.
* **Outliers:** Llama-3.1-8B has the highest score in the Multiple Choice chart, standing out from the other models. Mistral-7B-v0.1 has a relatively low Generation score compared to its Multiple Choice score.
* **Trend Lines:** The trend lines for Owen2.5 models are relatively smooth and indicate consistent improvement with increasing model size.
### Interpretation
The data suggests that increasing model size generally improves performance on the RuoZhiBench benchmark, particularly for the Owen2.5 family of models. The stronger correlation observed in the Multiple Choice scores compared to Generation scores might indicate that larger models are better at tasks requiring reasoning and knowledge retrieval. The outlier performance of Llama-3.1-8B in the Multiple Choice task suggests that this model may have architectural or training advantages. The discrepancy in scores for Mistral-7B-v0.1 could be due to its specific training data or architecture, making it more suited for multiple-choice questions than text generation. The logarithmic scale on the x-axis highlights the diminishing returns of increasing model size; the improvement in scores appears to slow down as the model size grows. The use of dashed vs solid lines for the Owen2.5-3B model in the Generation chart is unclear and may be a visual artifact.