## Dual Scatter Plots: Model Size vs. RuozhiBench Scores
### Overview
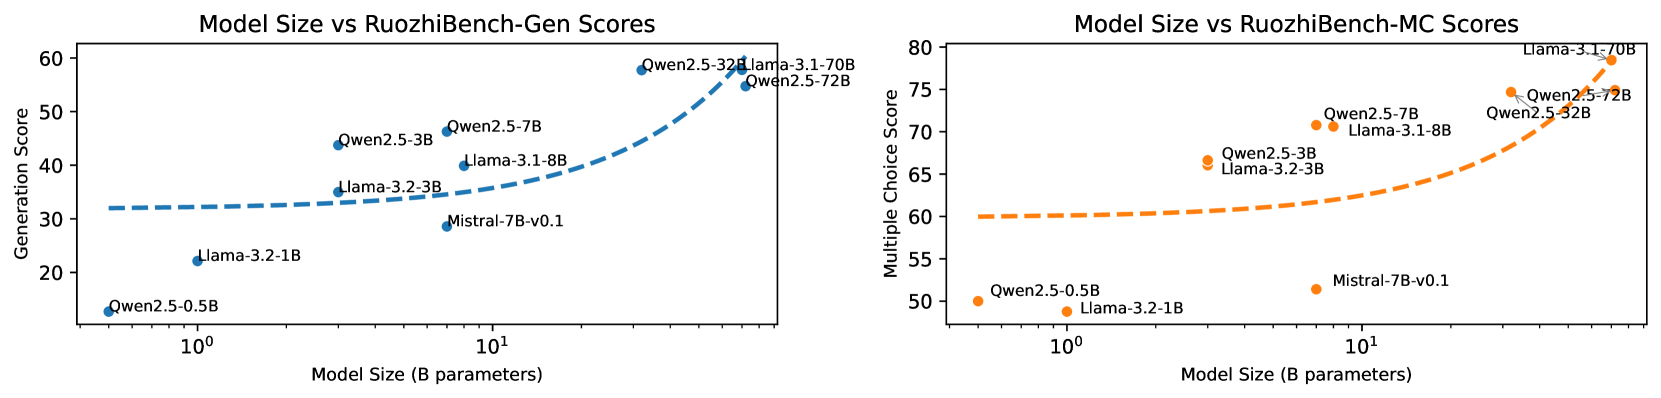
The image displays two side-by-side scatter plots comparing the performance of various large language models (LLMs) on two different benchmark tasks against their model size. The left plot evaluates "Generation Score," and the right plot evaluates "Multiple Choice Score." Both plots use a logarithmic scale for the x-axis (Model Size) and include a dashed trend line suggesting a general performance increase with model size.
### Components/Axes
**Common Elements:**
* **X-Axis (Both Plots):** Label: `Model Size (B parameters)`. Scale: Logarithmic. Major tick markers are visible at `10^0` (1 billion) and `10^1` (10 billion).
* **Data Points:** Each point represents a specific model, labeled with its name. The points are colored to match their respective plot's theme (blue for left, orange for right).
* **Trend Line:** A dashed line in each plot shows the general trend of the data.
**Left Plot: Model Size vs RuozhiBench-Gen Scores**
* **Title:** `Model Size vs RuozhiBench-Gen Scores`
* **Y-Axis:** Label: `Generation Score`. Scale: Linear, ranging from approximately 20 to 60.
* **Data Series Color:** Blue.
* **Legend/Label Placement:** Model names are placed directly adjacent to their corresponding data points.
**Right Plot: Model Size vs RuozhiBench-MC Scores**
* **Title:** `Model Size vs RuozhiBench-MC Scores`
* **Y-Axis:** Label: `Multiple Choice Score`. Scale: Linear, ranging from approximately 50 to 80.
* **Data Series Color:** Orange.
* **Legend/Label Placement:** Model names are placed directly adjacent to their corresponding data points.
### Detailed Analysis
**Left Plot (Generation Score - Blue):**
* **Trend Verification:** The blue dashed trend line starts relatively flat around a score of 32 for smaller models and curves upward sharply for models larger than ~10B parameters, indicating accelerating returns to scale for generation tasks.
* **Data Points (Approximate Values):**
* `Qwen2.5-0.5B`: ~13 (Size: ~0.5B)
* `Llama-3.2-1B`: ~22 (Size: ~1B)
* `Llama-3.2-3B`: ~35 (Size: ~3B)
* `Qwen2.5-3B`: ~44 (Size: ~3B)
* `Mistral-7B-v0.1`: ~29 (Size: ~7B) - *Notable underperformer relative to trend.*
* `Llama-3.1-8B`: ~40 (Size: ~8B)
* `Qwen2.5-7B`: ~46 (Size: ~7B)
* `Qwen2.5-32B`: ~58 (Size: ~32B)
* `Llama-3.1-70B`: ~59 (Size: ~70B)
* `Qwen2.5-72B`: ~55 (Size: ~72B)
**Right Plot (Multiple Choice Score - Orange):**
* **Trend Verification:** The orange dashed trend line starts around a score of 60 for smaller models and curves upward for models larger than ~10B parameters, similar to the left plot but with a higher baseline.
* **Data Points (Approximate Values):**
* `Qwen2.5-0.5B`: ~50 (Size: ~0.5B)
* `Llama-3.2-1B`: ~49 (Size: ~1B)
* `Llama-3.2-3B`: ~66 (Size: ~3B)
* `Qwen2.5-3B`: ~67 (Size: ~3B)
* `Mistral-7B-v0.1`: ~51 (Size: ~7B) - *Significant underperformer.*
* `Llama-3.1-8B`: ~71 (Size: ~8B)
* `Qwen2.5-7B`: ~71 (Size: ~7B)
* `Qwen2.5-32B`: ~75 (Size: ~32B)
* `Qwen2.5-72B`: ~78 (Size: ~72B)
* `Llama-3.1-70B`: ~79 (Size: ~70B)
### Key Observations
1. **Scale Law Confirmation:** Both plots visually confirm a positive correlation between model size (in billions of parameters) and performance on the RuozhiBench benchmarks. The relationship appears non-linear, with more significant gains at larger scales.
2. **Task Difficulty Baseline:** The baseline performance (for the smallest models) is notably lower for the Generation task (~13-22) compared to the Multiple Choice task (~49-50), suggesting the generation task is more challenging.
3. **Model Family Performance:** Within the Qwen2.5 series, performance scales consistently with size on both tasks. The Llama-3.1/3.2 series also shows strong scaling.
4. **Significant Outlier:** `Mistral-7B-v0.1` is a clear underperformer on both benchmarks relative to its size and compared to other 7B/8B models like `Qwen2.5-7B` and `Llama-3.1-8B`.
5. **Top Performers:** At the largest scales (~70B+), `Llama-3.1-70B` and `Qwen2.5-72B` are the top performers, with `Llama-3.1-70B` having a slight edge in both plots.
### Interpretation
The data demonstrates the "scaling laws" phenomenon in LLMs, where increasing model capacity generally leads to better performance on standardized benchmarks. The RuozhiBench appears to be a useful tool for differentiating model capabilities, particularly at larger scales.
The stark underperformance of `Mistral-7B-v0.1` suggests that factors beyond raw parameter count—such as training data quality, training duration, architecture, or alignment techniques—play a critical role in determining a model's final benchmark score. It may represent an older or less optimized model version.
The consistent performance gap between the Generation and Multiple Choice tasks implies that generative fluency and coherence (tested in Gen) are harder for current models to master than knowledge retrieval and reasoning in a constrained format (tested in MC). The upward curve of the trend lines suggests that we have not yet hit a performance plateau, and further scaling or architectural improvements could yield continued gains on these specific tasks.