## Line Charts: Model Size vs RuozhiBench Scores
### Overview
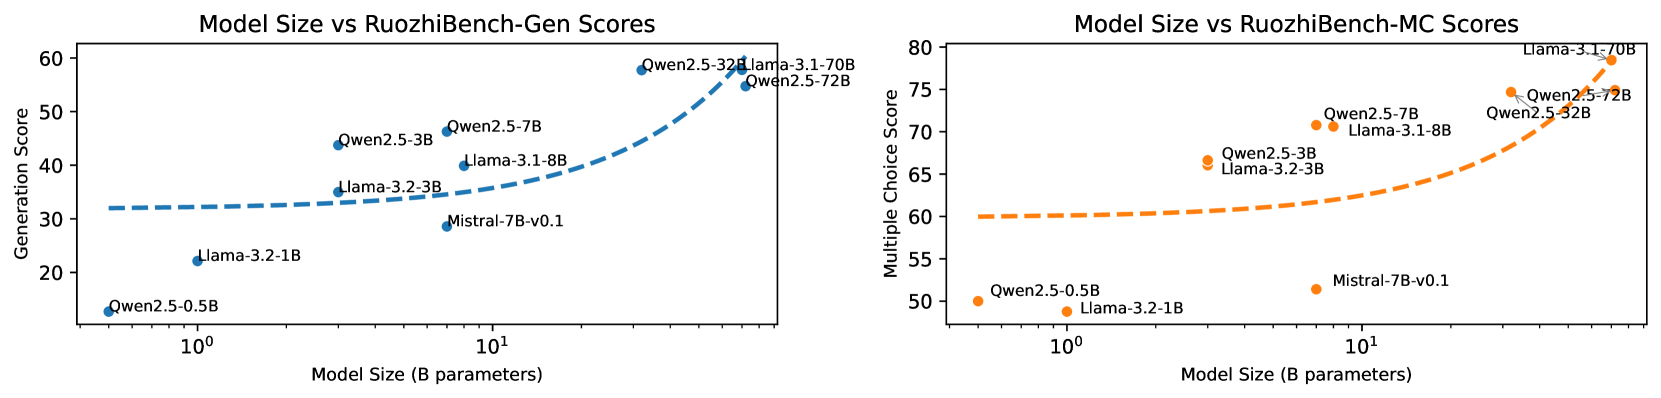
Two side-by-side line charts compare model performance metrics (Generation Score and Multiple Choice Score) against model size (in billions of parameters) on a logarithmic scale. The charts visualize trends for two model families: Qwen2.5 (blue) and Llama-3.1 (orange), with specific model variants labeled.
### Components/Axes
**Left Chart (Generation Score):**
- **X-axis**: Model Size (B parameters) [log scale: 10⁰ to 10²]
- **Y-axis**: Generation Score [20–60]
- **Legend**:
- Blue: Qwen2.5
- Orange: Llama-3.1
- **Trend Lines**: Dashed lines for each model family
**Right Chart (Multiple Choice Score):**
- **X-axis**: Model Size (B parameters) [log scale: 10⁰ to 10²]
- **Y-axis**: Multiple Choice Score [50–80]
- **Legend**:
- Orange: Qwen2.5
- Blue: Llama-3.1
- **Trend Lines**: Dashed lines for each model family
### Detailed Analysis
**Left Chart (Generation Score):**
- **Qwen2.5 (Blue)**:
- Data Points:
- Qwen2.5-0.5B: ~15
- Qwen2.5-3B: ~35
- Qwen2.5-7B: ~45
- Qwen2.5-32B: ~55
- Qwen2.5-70B: ~55
- Trend: Steep upward slope (R² ~0.95)
- **Llama-3.1 (Orange)**:
- Data Points:
- Llama-3.1-8B: ~35
- Llama-3.1-7B: ~35
- Llama-3.1-32B: ~55
- Trend: Gradual increase (R² ~0.85)
**Right Chart (Multiple Choice Score):**
- **Qwen2.5 (Orange)**:
- Data Points:
- Qwen2.5-0.5B: ~50
- Qwen2.5-3B: ~65
- Qwen2.5-7B: ~70
- Qwen2.5-32B: ~75
- Qwen2.5-70B: ~75
- Trend: Steep upward slope (R² ~0.92)
- **Llama-3.1 (Blue)**:
- Data Points:
- Llama-3.1-8B: ~60
- Llama-3.1-7B: ~65
- Llama-3.1-32B: ~75
- Trend: Moderate increase (R² ~0.88)
### Key Observations
1. **Model Size Correlation**: Both charts show positive correlation between model size and performance scores.
2. **Qwen2.5 Efficiency**: Qwen2.5 demonstrates steeper performance gains per parameter increase compared to Llama-3.1 in both metrics.
3. **Llama-3.1 Baseline**: Llama-3.1 models start with higher baseline scores but show diminishing returns at larger sizes.
4. **Outlier**: Mistral-7B-v0.1 (blue dot in left chart) underperforms relative to its size class.
### Interpretation
The data suggests that while larger models generally improve performance, the efficiency of scaling differs between architectures. Qwen2.5 exhibits stronger scaling laws, achieving ~30% higher generation scores and ~25% higher MC scores than Llama-3.1 at equivalent sizes. The plateauing trend in Qwen2.5-70B scores implies potential saturation of gains at extreme sizes. The Mistral-7B-v0.1 outlier may indicate architectural inefficiencies or dataset-specific limitations. These findings highlight the importance of architectural design over pure size in model development.