## Biological Diagram: Neuronal Synaptic Transmission and Astrocyte Interaction
### Overview
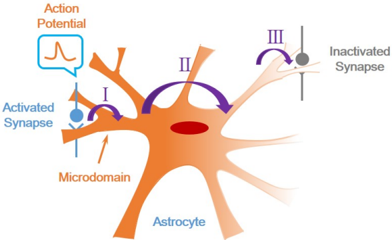
The image is a simplified biological diagram illustrating synaptic transmission between neurons and the interaction with an astrocyte. It depicts key stages of neuronal signaling, including action potential propagation, synaptic activation/inactivation, and the role of a microdomain in this process. The diagram uses color-coded elements and directional arrows to represent molecular/cellular interactions.
### Components/Axes
1. **Central Neuron**:
- **Cell Body**: Orange gradient with a red oval nucleus.
- **Dendrites**: Branching structures extending from the cell body.
- **Axon**: Single elongated projection from the cell body.
2. **Astrocyte**:
- Star-shaped cell adjacent to the neuron, labeled in blue text.
3. **Synapses**:
- **Activated Synapse**: Blue-labeled structure on the left dendrite, with a waveform labeled "Action Potential."
- **Inactivated Synapse**: Gray-labeled structure on the right axon terminal.
4. **Microdomain**:
- Orange-labeled region on the neuron near the activated synapse.
5. **Arrows**:
- Purple arrows (I, II, III) indicate directional flow:
- **I**: From activated synapse to microdomain.
- **II**: From microdomain to inactivated synapse.
- **III**: From inactivated synapse back to the neuron.
### Detailed Analysis
- **Action Potential**: Depicted as a waveform (orange line) entering the activated synapse, initiating signaling.
- **Activated Synapse**: Positioned on the left dendrite, connected via arrow I to the microdomain.
- **Microdomain**: Central hub for signal integration, linking activated and inactivated synapses.
- **Inactivated Synapse**: Located on the right axon terminal, receiving input via arrow II and returning signal via arrow III.
- **Astrocyte**: Positioned near the neuron but not directly connected by labeled pathways, suggesting a supportive or modulatory role.
### Key Observations
1. **Signal Flow**: The diagram emphasizes a unidirectional flow (I → II) from activated to inactivated synapses via the microdomain, with a feedback loop (III) from the inactivated synapse.
2. **Astrocyte Proximity**: The astrocyte is spatially adjacent to the neuron but lacks direct labeled connections, implying indirect interaction.
3. **Simplification**: The neuron is stylized (e.g., single axon, no myelin sheath), prioritizing conceptual clarity over anatomical accuracy.
### Interpretation
This diagram illustrates the **synaptic transmission cycle** and highlights the **microdomain** as a critical node for signal integration. The inclusion of the astrocyte suggests its potential role in modulating synaptic activity, though the lack of direct connections implies this interaction is not explicitly detailed. The feedback loop (arrow III) may represent autoregulatory mechanisms or retrograde signaling. The absence of quantitative data (e.g., ion concentrations, timeframes) indicates the focus is on qualitative relationships rather than mechanistic precision. The diagram serves as an educational tool to visualize high-level concepts in neurobiology, emphasizing spatial organization and functional connectivity over molecular detail.