\n
## Diagram: Quantum Optical Setup and Entanglement Analysis
### Overview
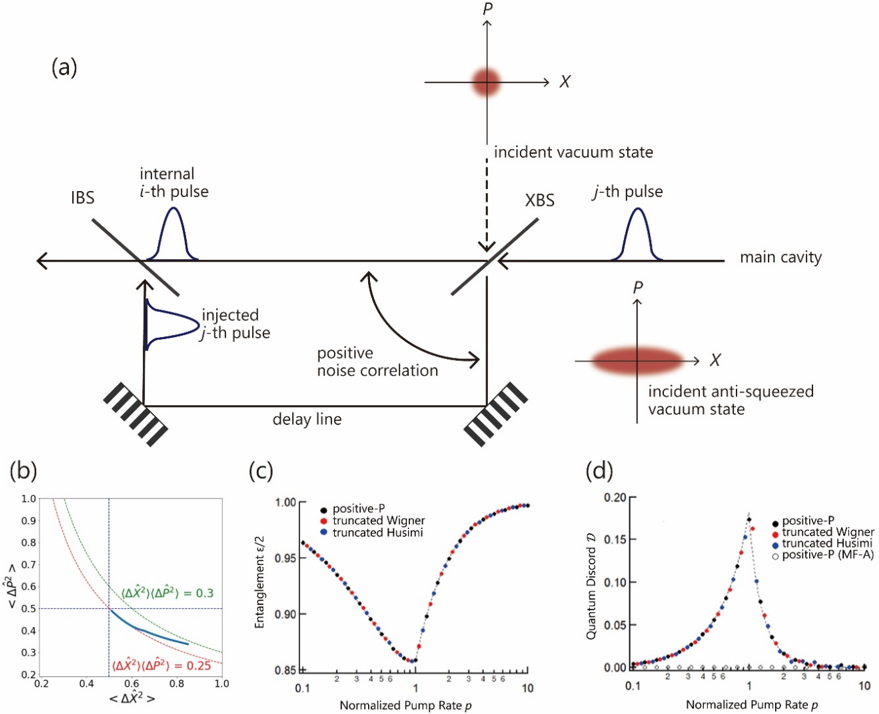
The image presents a diagram of a quantum optical setup involving an intracavity beam splitter (IBS) and an external beam splitter (XBS), alongside three plots analyzing entanglement and quantum discord as a function of normalized pump rate. The setup appears designed to generate and analyze non-classical states of light.
### Components/Axes
The diagram consists of four sub-images labeled (a), (b), (c), and (d).
**(a) Quantum Optical Setup:**
* **IBS:** Intracavity Beam Splitter.
* **XBS:** External Beam Splitter.
* **Main Cavity:** Represented by parallel lines.
* **Incident Vacuum State:** Labeled above the XBS.
* **Incident Anti-squeezed Vacuum State:** Labeled below the XBS.
* **Internal i-th pulse:** Injected into the IBS.
* **Injected j-th pulse:** Injected into the IBS.
* **Delay Line:** Connecting the IBS and XBS.
* **Positive Noise Correlation:** Arrow indicating correlation between pulses.
* **P & X axes:** Representing momentum and position quadratures, shown as ellipses.
**(b) Variance Plot:**
* **X-axis:** `<ΔX²>` (approximately 0.2 to 1.0).
* **Y-axis:** `V = Δ²P / <ΔX²>` (approximately 0.2 to 0.9).
* **Curves:** Two curves are plotted, labeled with equations: `(ΔX²)(ΔP²) = 0.3` (green) and `(ΔX²)(ΔP²) = 0.25` (blue).
**(c) Entanglement Plot:**
* **X-axis:** Normalized Pump Rate ρ (approximately 0.1 to 10).
* **Y-axis:** Entanglement E/2 (approximately 0.85 to 1.0).
* **Curves:** Three curves are plotted:
* positive-P (red)
* truncated Wigner (blue)
* truncated Husimi (black)
**(d) Quantum Discord Plot:**
* **X-axis:** Normalized Pump Rate ρ (approximately 0.1 to 10).
* **Y-axis:** Quantum Discord D (approximately 0.0 to 0.2).
* **Curves:** Three curves are plotted:
* positive-P (red)
* truncated Wigner (blue)
* truncated Husimi (black) and positive-P (MF-A) (grey)
### Detailed Analysis or Content Details
**(a) Quantum Optical Setup:**
The setup involves injecting pulses into a cavity containing an intracavity beam splitter. The XBS splits the output, and the delay line introduces a time delay between the pulses. The diagram indicates a positive correlation between the noise in the pulses. The P and X axes represent the quadratures of the electromagnetic field.
**(b) Variance Plot:**
The green curve `(ΔX²)(ΔP²) = 0.3` starts at approximately V = 0.85 when `<ΔX²>` = 0.2, and decreases to approximately V = 0.3 when `<ΔX²>` = 1.0. The blue curve `(ΔX²)(ΔP²) = 0.25` starts at approximately V = 0.7 when `<ΔX²>` = 0.2, and decreases to approximately V = 0.25 when `<ΔX²>` = 1.0. Both curves exhibit a decreasing trend.
**(c) Entanglement Plot:**
All three curves (positive-P, truncated Wigner, truncated Husimi) start at approximately E/2 = 0.98 when ρ = 0.1. As ρ increases, all curves decrease. The positive-P curve (red) decreases more rapidly than the other two. At ρ = 10, the positive-P curve reaches approximately E/2 = 0.86, the truncated Wigner curve reaches approximately E/2 = 0.88, and the truncated Husimi curve reaches approximately E/2 = 0.90.
**(d) Quantum Discord Plot:**
The positive-P curve (red) starts at approximately D = 0.02 when ρ = 0.1 and increases to a peak of approximately D = 0.16 at ρ = 3. It then decreases to approximately D = 0.05 at ρ = 10. The truncated Wigner curve (blue) starts at approximately D = 0.01 when ρ = 0.1 and increases to a peak of approximately D = 0.12 at ρ = 3. It then decreases to approximately D = 0.03 at ρ = 10. The truncated Husimi curve (black) and positive-P (MF-A) (grey) are very close to zero across the entire range of ρ.
### Key Observations
* The variance plot (b) shows an inverse relationship between the variances of the position and momentum quadratures, consistent with the uncertainty principle.
* The entanglement plot (c) demonstrates that entanglement decreases as the normalized pump rate increases.
* The quantum discord plot (d) shows that quantum discord initially increases with the pump rate, reaches a maximum, and then decreases.
* The positive-P method appears to show the most significant decrease in entanglement with increasing pump rate.
* The truncated Husimi and positive-P (MF-A) methods show minimal quantum discord.
### Interpretation
The diagram illustrates a setup for generating and characterizing non-classical states of light. The plots reveal the interplay between entanglement and quantum discord as a function of the pump rate. The decrease in entanglement with increasing pump rate suggests that the system transitions from a highly entangled state to a more classical state. The behavior of quantum discord, which can be non-zero even in the absence of entanglement, indicates the presence of quantum correlations beyond entanglement. The differences between the curves obtained using different methods (positive-P, truncated Wigner, truncated Husimi) highlight the sensitivity of these measures to the specific state representation used. The setup and analysis likely aim to explore the limits of entanglement and quantum correlations in optical systems and to understand the role of noise and decoherence in these processes. The positive noise correlation is likely a key element in the dynamics of the system. The choice of the pump rate is critical in controlling the degree of entanglement and quantum discord.