# Technical Data Extraction: AUROC Performance by Representation Type
## 1. Document Overview
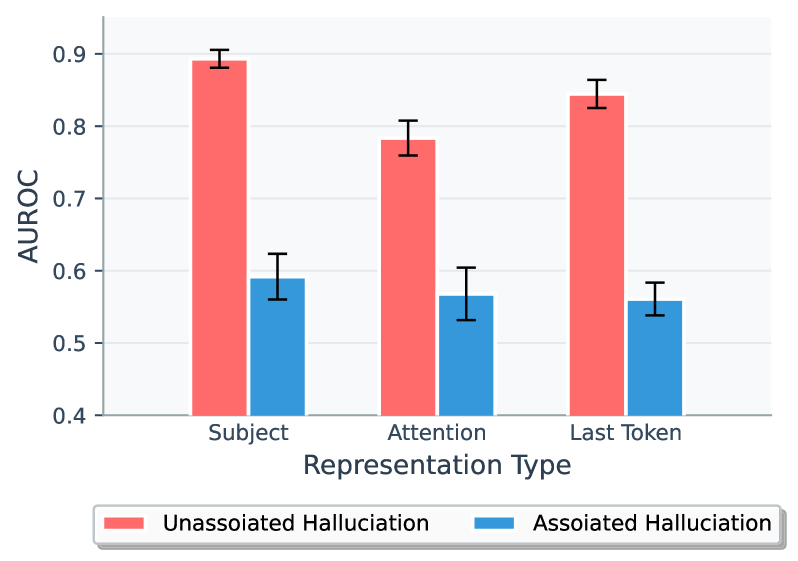
This image is a grouped bar chart comparing the performance (measured in AUROC) of two different hallucination categories across three distinct representation types. The chart includes error bars representing variability or confidence intervals for each data point.
## 2. Component Isolation
### A. Header / Axis Labels
* **Y-Axis Title:** AUROC
* **X-Axis Title:** Representation Type
* **Y-Axis Scale:** 0.4 to 0.9 (increments of 0.1 marked, with grid lines every 0.05).
* **X-Axis Categories:** Subject, Attention, Last Token.
### B. Legend (Spatial Grounding: Bottom Center)
* **Red Bar (Left in group):** Unassociated Hallucination (Note: Corrected from "Unassoiated Halluciation" in original image).
* **Blue Bar (Right in group):** Associated Hallucination (Note: Corrected from "Assoiated Halluciation" in original image).
---
## 3. Data Table Reconstruction
The following values are estimated based on the visual alignment with the Y-axis grid lines.
| Representation Type | Unassociated Hallucination (Red) | Associated Hallucination (Blue) |
| :--- | :--- | :--- |
| **Subject** | ~0.89 (Error: ±0.015) | ~0.59 (Error: ±0.03) |
| **Attention** | ~0.78 (Error: ±0.025) | ~0.57 (Error: ±0.035) |
| **Last Token** | ~0.84 (Error: ±0.02) | ~0.56 (Error: ±0.025) |
---
## 4. Trend Verification and Analysis
### Unassociated Hallucination (Red Series)
* **Visual Trend:** The series starts at its highest point at "Subject," drops significantly at "Attention," and then recovers partially at "Last Token."
* **Performance:** This category consistently outperforms the "Associated" category across all representation types, maintaining an AUROC above 0.75.
* **Peak:** Highest performance is achieved using the **Subject** representation (~0.89).
### Associated Hallucination (Blue Series)
* **Visual Trend:** The series shows a slight, steady downward slope from left to right.
* **Performance:** This category performs significantly worse than the "Unassociated" category, hovering between 0.55 and 0.60 AUROC, which is closer to random chance (0.5) than the red series.
* **Peak:** Highest performance is achieved using the **Subject** representation (~0.59).
---
## 5. Technical Observations
* **Gap Analysis:** There is a substantial performance gap (approx. 0.2 to 0.3 AUROC) between Unassociated and Associated hallucinations across all tested representations.
* **Error Bars:** The error bars for "Unassociated Hallucination" at the "Subject" position are the smallest, suggesting the highest precision/consistency in that specific measurement. The "Attention" and "Associated" categories generally show larger error bars, indicating higher variance.
* **Textual Note:** There are spelling errors in the legend of the source image ("Unassoiated" and "Assoiated" instead of "Unassociated" and "Associated").