## Bar Chart: AUROC Comparison by Hallucination Type and Representation
### Overview
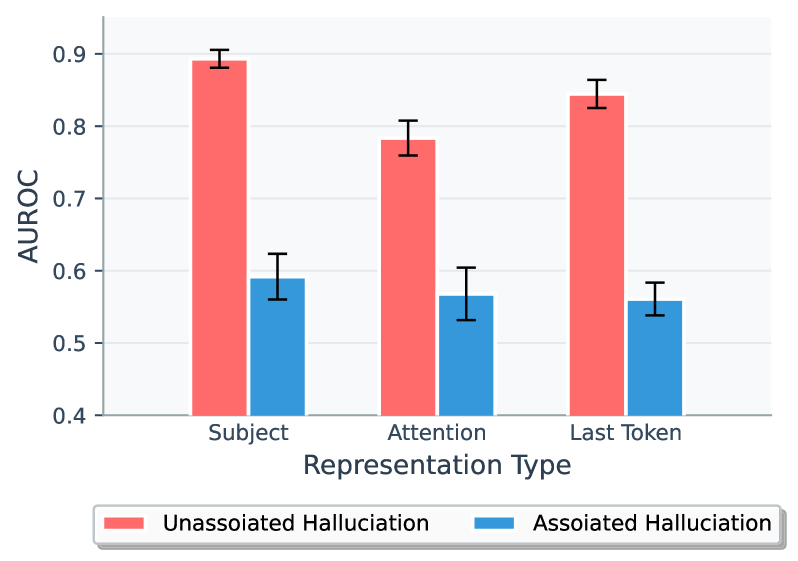
The image is a grouped bar chart with error bars, comparing the Area Under the Receiver Operating Characteristic curve (AUROC) for two types of hallucinations across three different representation types. The chart visually demonstrates a consistent performance gap between the two hallucination categories.
### Components/Axes
* **Y-Axis:** Labeled **"AUROC"**. The scale ranges from 0.4 to 0.9, with major grid lines at 0.1 intervals (0.4, 0.5, 0.6, 0.7, 0.8, 0.9).
* **X-Axis:** Labeled **"Representation Type"**. It contains three categorical groups:
1. **Subject**
2. **Attention**
3. **Last Token**
* **Legend:** Positioned at the bottom center of the chart.
* **Red Bar:** Labeled **"Unassociated Hallucination"**.
* **Blue Bar:** Labeled **"Associated Hallucination"**.
* **Error Bars:** Black vertical lines extending from the top of each bar, indicating variability or confidence intervals around the mean AUROC value.
### Detailed Analysis
The chart presents the following approximate AUROC values (estimated from the grid lines) and trends for each representation type:
**1. Subject Representation:**
* **Unassociated Hallucination (Red):** The bar is the tallest in the chart, reaching approximately **0.89**. The error bar spans roughly from 0.88 to 0.90.
* **Associated Hallucination (Blue):** The bar is significantly shorter, at approximately **0.59**. The error bar spans roughly from 0.56 to 0.62.
* **Trend:** This category shows the largest performance gap between the two hallucination types.
**2. Attention Representation:**
* **Unassociated Hallucination (Red):** The bar reaches approximately **0.78**. The error bar spans roughly from 0.76 to 0.80.
* **Associated Hallucination (Blue):** The bar reaches approximately **0.56**. The error bar spans roughly from 0.53 to 0.60.
* **Trend:** Both values are lower than their counterparts in the "Subject" category, but the gap remains substantial.
**3. Last Token Representation:**
* **Unassociated Hallucination (Red):** The bar reaches approximately **0.84**. The error bar spans roughly from 0.82 to 0.86.
* **Associated Hallucination (Blue):** The bar reaches approximately **0.56**. The error bar spans roughly from 0.54 to 0.58.
* **Trend:** The Unassociated value is high (second only to "Subject"), while the Associated value is similar to that of the "Attention" category.
### Key Observations
1. **Consistent Performance Gap:** Across all three representation types (Subject, Attention, Last Token), the AUROC for **Unassociated Hallucination** is markedly higher than for **Associated Hallucination**.
2. **Highest and Lowest Points:** The highest measured AUROC is for Unassociated Hallucination using the **Subject** representation (~0.89). The lowest measured AUROC is for Associated Hallucination using the **Attention** representation (~0.56).
3. **Stability of Associated Hallucination Scores:** The AUROC values for Associated Hallucination are relatively stable and low across all representation types, clustering between approximately 0.56 and 0.59.
4. **Variability:** The error bars suggest moderate variability in the measurements, with the largest apparent spread (uncertainty) seen in the Associated Hallucination score for the "Subject" representation.
### Interpretation
This chart likely comes from a study evaluating methods for detecting hallucinations in AI models (e.g., large language models). The data suggests a fundamental difference in the detectability of the two hallucination types:
* **Unassociated Hallucinations** (likely errors where the model generates information not associated with the input context) appear to be **significantly easier to detect**, as indicated by the high AUROC scores (approaching 0.9). The "Subject" representation is the most effective signal for this detection.
* **Associated Hallucinations** (likely errors where the model generates information that is associated with but incorrect or distorted from the input context) are **much harder to detect**, with AUROC scores hovering just above 0.5. An AUROC of 0.5 represents random guessing, so these scores indicate only a slight detectability advantage over chance.
The implication is that current representation-based detection methods are relatively successful at flagging completely fabricated, context-free information but struggle significantly with more subtle errors that are contextually linked. This highlights a key challenge in AI safety and reliability: catching the more insidious, associated mistakes. The choice of representation ("Subject," "Attention," "Last Token") has a notable impact on detecting unassociated hallucinations but a minimal impact on detecting associated ones.