## Line Chart: Number of Detectors vs. Iteration Number
### Overview
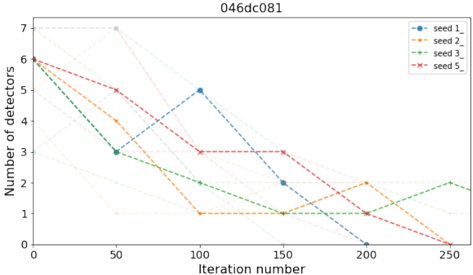
The image is a line chart displaying the number of detectors over a range of iterations for different seeds. The chart shows how the number of detectors changes as the iteration number increases, with data for four different seeds represented by different colored lines. There are also fainter lines in the background.
### Components/Axes
* **Title:** 046dc081 (located at the top of the chart)
* **X-axis:**
* Label: "Iteration number"
* Scale: 0 to 250, with markers at 0, 50, 100, 150, 200, and 250.
* **Y-axis:**
* Label: "Number of detectors"
* Scale: 0 to 7, with markers at 0, 1, 2, 3, 4, 5, 6, and 7.
* **Legend:** Located in the top-right corner.
* Blue line with circle markers: "seed 1"
* Orange line with square markers: "seed 2"
* Green line with plus markers: "seed 3"
* Red line with cross markers: "seed 5"
### Detailed Analysis
* **Seed 1 (Blue):** Starts at approximately 6 detectors at iteration 0. Decreases to approximately 3 detectors at iteration 50. Increases to approximately 5 detectors at iteration 100. Decreases to approximately 2 detectors at iteration 150. Decreases to approximately 0 detectors at iteration 250.
* **Seed 2 (Orange):** Starts at approximately 6 detectors at iteration 0. Decreases to approximately 4 detectors at iteration 50. Decreases to approximately 1 detector at iteration 100. Remains at approximately 1 detector at iteration 150. Increases to approximately 2 detectors at iteration 200. Decreases to approximately 0 detectors at iteration 250.
* **Seed 3 (Green):** Starts at approximately 6 detectors at iteration 0. Decreases to approximately 3 detectors at iteration 50. Decreases to approximately 2 detectors at iteration 100. Decreases to approximately 1 detector at iteration 150. Increases to approximately 2 detectors at iteration 250.
* **Seed 5 (Red):** Starts at approximately 6 detectors at iteration 0. Decreases to approximately 5 detectors at iteration 50. Decreases to approximately 3 detectors at iteration 100. Remains at approximately 3 detectors at iteration 150. Decreases to approximately 2 detectors at iteration 200. Decreases to approximately 0 detectors at iteration 250.
### Key Observations
* All seeds start with approximately 6 detectors at iteration 0.
* Seeds 1, 2, and 5 all end with 0 detectors at iteration 250.
* Seed 3 ends with approximately 2 detectors at iteration 250.
* The number of detectors generally decreases as the iteration number increases for all seeds.
* There are some fluctuations in the number of detectors for each seed, but the overall trend is downward.
### Interpretation
The chart illustrates the performance of different seeds in terms of the number of detectors they maintain over a series of iterations. The general downward trend suggests that the detectors are being eliminated or becoming inactive as the iterations progress. The different seeds exhibit varying rates of detector loss, with some seeds (1, 2, and 5) eventually reaching zero detectors, while others (seed 3) maintain a small number of detectors even after 250 iterations. This could indicate that seed 3 has a more robust or stable configuration compared to the other seeds. The fainter lines in the background likely represent other seeds or trials, providing additional context for the overall trend.