\n
## Line Chart: Detector Count vs. Iteration Number
### Overview
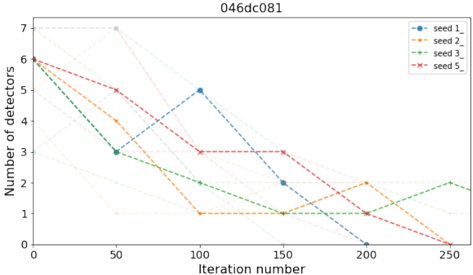
The image presents a line chart illustrating the number of detectors remaining over iteration number for different random seeds. The chart appears to track a reduction in detector count as the iteration number increases, with varying rates of decline depending on the seed used.
### Components/Axes
* **X-axis:** Iteration number, ranging from approximately 0 to 250.
* **Y-axis:** Number of detectors, ranging from 0 to 7.
* **Legend:** Located in the top-right corner, identifying the lines by seed number:
* seed 1 (Blue, dashed line with circle markers)
* seed 2 (Orange, dashed line with square markers)
* seed 3 (Green, dashed line with plus markers)
* seed 5 (Red, dashed line with x markers)
* **Title:** "046dc081" located in the top-center of the chart.
### Detailed Analysis
Let's analyze each line individually, noting trends and approximate data points:
* **seed 1 (Blue):** Starts at approximately 6 detectors at iteration 0. Decreases steadily to around 3 detectors at iteration 50. Increases sharply to approximately 5.2 detectors at iteration 100, then declines rapidly to 0 detectors by iteration 200.
* **seed 2 (Orange):** Begins at approximately 6 detectors at iteration 0. Decreases rapidly to approximately 1 detector at iteration 100. Fluctuates between 1 and 2 detectors from iteration 100 to 250, ending at approximately 1.5 detectors at iteration 250.
* **seed 3 (Green):** Starts at approximately 6 detectors at iteration 0. Decreases steadily to approximately 3 detectors at iteration 50. Continues to decline to approximately 1 detector at iteration 150. Increases slightly to approximately 1.8 detectors at iteration 250.
* **seed 5 (Red):** Starts at approximately 6 detectors at iteration 0. Decreases steadily to approximately 3 detectors at iteration 50. Continues to decline to approximately 1 detector at iteration 150. Decreases to approximately 0.2 detectors at iteration 250.
### Key Observations
* All seeds show a general trend of decreasing detector count with increasing iteration number.
* Seed 1 exhibits the most dramatic decline, reaching zero detectors relatively quickly.
* Seed 2 shows the slowest decline and remains above 1 detector for a significant portion of the iterations.
* Seeds 3 and 5 follow a similar trajectory, with seed 5 ultimately reaching the lowest detector count.
* There is significant variability in the rate of detector reduction depending on the initial seed.
### Interpretation
The chart likely represents a process where detectors are being eliminated or deactivated over time, potentially due to some form of filtering or selection mechanism. The different seeds suggest that the initial conditions or random variations within the process lead to different outcomes in terms of detector survival. The rapid decline observed for seed 1 could indicate a more aggressive filtering process or a higher sensitivity to certain conditions. The persistence of detectors for seed 2 suggests a more robust or resilient configuration. The fact that all lines eventually trend towards zero detectors suggests that the process is ultimately converging on a state with fewer or no detectors remaining. The title "046dc081" could be a unique identifier for this specific experiment or simulation run. The data suggests that the initial random seed has a significant impact on the dynamics of detector elimination.