\n
## Line Chart: Detector Count vs. Iteration Number for Multiple Seeds
### Overview
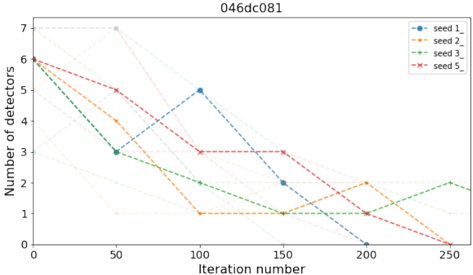
The image is a line chart titled "046dc081" that plots the "Number of detectors" on the y-axis against the "Iteration number" on the x-axis. It displays the performance or behavior of four distinct experimental runs, labeled as different "seeds," over a series of 250 iterations. The chart uses dashed lines with unique markers for each data series.
### Components/Axes
* **Chart Title:** "046dc081" (centered at the top).
* **Y-Axis:**
* **Label:** "Number of detectors" (vertical text on the left).
* **Scale:** Linear scale from 0 to 7, with major tick marks at every integer (0, 1, 2, 3, 4, 5, 6, 7).
* **X-Axis:**
* **Label:** "Iteration number" (horizontal text at the bottom).
* **Scale:** Linear scale from 0 to 250, with major tick marks labeled at 0, 50, 100, 150, 200, and 250.
* **Legend:** Located in the top-right corner of the plot area. It contains four entries:
1. `seed 1` - Blue line with circle markers (`-o`).
2. `seed 2` - Orange line with upward-pointing triangle markers (`-^`).
3. `seed 3` - Green line with plus sign markers (`-+`).
4. `seed 5` - Red line with 'x' markers (`-x`).
* **Grid:** A light gray grid is present in the background.
* **Additional Visual Elements:** Faint, light gray lines are visible in the background, suggesting the presence of other data series (possibly seeds 0, 4, 6, etc.) that are not highlighted in the legend.
### Detailed Analysis
The chart tracks the "Number of detectors" for four seeds over 250 iterations. All series begin at the same point.
**Data Series Trends and Approximate Points:**
1. **seed 1 (Blue, Circle):**
* **Trend:** Starts high, dips, experiences a significant mid-chart spike, then declines to zero.
* **Points:** (0, 6) -> (50, 3) -> (100, 5) -> (150, 2) -> (200, 0). The line ends at iteration 200.
2. **seed 2 (Orange, Triangle):**
* **Trend:** Shows a general decline with a minor recovery near the end before final drop.
* **Points:** (0, 6) -> (50, 4) -> (100, 1) -> (150, 1) -> (200, 2) -> (250, 0).
3. **seed 3 (Green, Plus):**
* **Trend:** Declines, plateaus, and is the only series to show a net increase from its lowest point at the final iteration.
* **Points:** (0, 6) -> (50, 3) -> (100, 2) -> (150, 1) -> (200, 1) -> (250, 2).
4. **seed 5 (Red, 'x'):**
* **Trend:** Declines in a step-like fashion, with a plateau in the middle.
* **Points:** (0, 6) -> (50, 5) -> (100, 3) -> (150, 3) -> (200, 1) -> (250, 0).
### Key Observations
* **Common Starting Point:** All four highlighted seeds begin with 6 detectors at iteration 0.
* **Divergent Paths:** Despite starting identically, the trajectories diverge significantly after the first iteration checkpoint (50).
* **Mid-Chart Anomaly:** `seed 1` exhibits a unique, sharp increase from 3 to 5 detectors between iterations 50 and 100, which is not seen in the other series.
* **Final State Variance:** At the final recorded iteration (250), three seeds (`1`, `2`, `5`) have converged to 0 detectors. `seed 3` is the outlier, ending with 2 detectors.
* **Plateaus:** Both `seed 2` (iterations 100-150) and `seed 5` (iterations 100-150) show periods where the detector count remains constant.
* **Background Data:** The presence of faint gray lines indicates this chart is likely a focused view of a larger dataset, highlighting four specific seeds of interest.
### Interpretation
This chart likely visualizes the results of an optimization or training process (e.g., in machine learning, evolutionary algorithms, or system simulation) where the "Number of detectors" is a key performance metric or a resource being managed. The "seed" probably refers to a random seed initializing the process.
The data suggests that the initial conditions (the seed) have a profound impact on the optimization trajectory. While the process generally trends toward reducing the number of detectors (possibly indicating efficiency gains, pruning, or convergence), the path is non-monotonic and highly variable. The spike in `seed 1` could represent a phase of exploration or a temporary suboptimal state before further optimization. The fact that `seed 3` ends with a higher count than its minimum suggests it may have settled in a different local optimum or that the process was halted before full convergence. The chart effectively demonstrates the stochastic nature of the underlying process and the importance of multiple runs (different seeds) to understand the range of possible outcomes.