## Line Chart: Seed Performance Over Iterations
### Overview
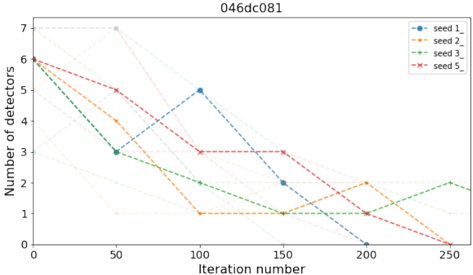
The chart illustrates the number of detectors identified across 250 iterations for four distinct "seeds" (labeled Seed 1, Seed 2, Seed 3, Seed 5). Each seed's performance is represented by a colored line, showing fluctuations in detector counts over time. The y-axis ranges from 0 to 7 detectors, while the x-axis spans 0 to 250 iterations.
### Components/Axes
- **X-axis (Iteration Number)**: Labeled "Iteration number," with markers at 0, 50, 100, 150, 200, and 250.
- **Y-axis (Number of Detectors)**: Labeled "Number of detectors," with integer increments from 0 to 7.
- **Legend**: Located in the top-right corner, associating colors with seeds:
- **Seed 1**: Blue (dashed line with circles)
- **Seed 2**: Orange (dotted line with squares)
- **Seed 3**: Green (dashed-dotted line with triangles)
- **Seed 5**: Red (solid line with crosses)
### Detailed Analysis
1. **Seed 1 (Blue)**:
- Starts at **6 detectors** at iteration 0.
- Drops to **3 detectors** by iteration 50.
- Peaks at **5 detectors** at iteration 100.
- Declines sharply to **0 detectors** by iteration 200.
- Remains at 0 until iteration 250.
2. **Seed 2 (Orange)**:
- Begins at **6 detectors** at iteration 0.
- Plummets to **1 detector** by iteration 50.
- Stabilizes at **1 detector** until iteration 200.
- Drops to **0 detectors** by iteration 250.
3. **Seed 3 (Green)**:
- Starts at **6 detectors** at iteration 0.
- Decreases to **2 detectors** by iteration 100.
- Rises to **2 detectors** at iteration 150.
- Increases to **3 detectors** by iteration 200.
- Drops to **2 detectors** by iteration 250.
4. **Seed 5 (Red)**:
- Begins at **6 detectors** at iteration 0.
- Declines to **3 detectors** by iteration 50.
- Remains at **3 detectors** until iteration 150.
- Drops to **0 detectors** by iteration 200.
- Stays at 0 until iteration 250.
### Key Observations
- **Seed 1** exhibits the most volatility, with a sharp rise and fall, suggesting a transient detection strategy.
- **Seed 2** shows rapid initial decline but stabilizes at a low level, indicating persistent but minimal detection.
- **Seed 3** demonstrates a late-stage recovery, with detector counts increasing after iteration 150.
- **Seed 5** maintains moderate performance until iteration 150, then collapses entirely.
### Interpretation
The data suggests that Seed 1 and Seed 5 initially perform strongly but fail to sustain detection over time, possibly due to resource exhaustion or algorithmic limitations. Seed 3’s late recovery implies adaptive mechanisms that improve performance as iterations progress. Seed 2’s stability at low levels may indicate a conservative approach with limited scalability. The sharp declines (e.g., Seed 1 at iteration 200) could reflect system resets, parameter adjustments, or external constraints. Notably, no seed maintains consistent high performance, highlighting trade-offs between early gains and long-term stability.