## Line Chart: Model Performance Across Context Lengths
### Overview
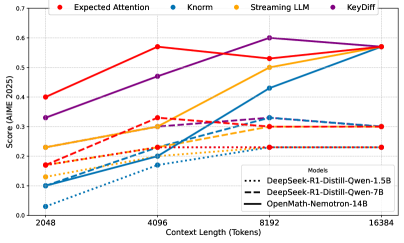
The image is a line chart comparing the performance of different AI models across four metrics (Expected Attention, Knorm, Streaming LLM, KeyDiff) as context length increases from 2048 to 16384 tokens. The y-axis represents a score (AIME 2025), while the x-axis represents context length in tokens. The chart includes three models: DeepSeek-R1-Distill-Qwen-1.5B (dotted lines), DeepSeek-R1-Distill-Qwen-7B (dashed lines), and OpenMath-Nemotron-14B (solid lines). Each metric is represented by a distinct color.
### Components/Axes
- **X-axis**: Context Length (Tokens) with values: 2048, 4096, 8192, 16384.
- **Y-axis**: Score (AIME 2025) ranging from 0.0 to 0.7.
- **Legend**: Located in the top-right corner. It includes:
- **Metrics**:
- Expected Attention (red)
- Knorm (blue)
- Streaming LLM (orange)
- KeyDiff (purple)
- **Models**:
- DeepSeek-R1-Distill-Qwen-1.5B (dotted lines)
- DeepSeek-R1-Distill-Qwen-7B (dashed lines)
- OpenMath-Nemotron-14B (solid lines)
### Detailed Analysis
#### Metrics Trends
1. **Expected Attention (Red)**:
- Starts at ~0.4 at 2048 tokens.
- Peaks at ~0.55 at 4096 tokens.
- Declines to ~0.5 at 8192 tokens.
- Slightly increases to ~0.55 at 16384 tokens.
2. **Knorm (Blue)**:
- Starts at ~0.1 at 2048 tokens.
- Increases to ~0.2 at 4096 tokens.
- Rises to ~0.4 at 8192 tokens.
- Peaks at ~0.55 at 16384 tokens.
3. **Streaming LLM (Orange)**:
- Starts at ~0.2 at 2048 tokens.
- Increases to ~0.3 at 4096 tokens.
- Rises to ~0.5 at 8192 tokens.
- Peaks at ~0.55 at 16384 tokens.
4. **KeyDiff (Purple)**:
- Starts at ~0.3 at 2048 tokens.
- Increases to ~0.45 at 4096 tokens.
- Peaks at ~0.6 at 8192 tokens.
- Slightly decreases to ~0.55 at 16384 tokens.
#### Model Performance
- **DeepSeek-R1-Distill-Qwen-1.5B (Dotted Lines)**:
- Expected Attention: ~0.1 (2048) → ~0.2 (4096) → ~0.3 (8192) → ~0.4 (16384).
- Knorm: ~0.1 (2048) → ~0.2 (4096) → ~0.3 (8192) → ~0.4 (16384).
- Streaming LLM: ~0.2 (2048) → ~0.3 (4096) → ~0.4 (8192) → ~0.5 (16384).
- KeyDiff: ~0.3 (2048) → ~0.4 (4096) → ~0.5 (8192) → ~0.55 (16384).
- **DeepSeek-R1-Distill-Qwen-7B (Dashed Lines)**:
- Expected Attention: ~0.2 (2048) → ~0.3 (4096) → ~0.4 (8192) → ~0.5 (16384).
- Knorm: ~0.2 (2048) → ~0.3 (4096) → ~0.4 (8192) → ~0.5 (16384).
- Streaming LLM: ~0.3 (2048) → ~0.4 (4096) → ~0.5 (8192) → ~0.55 (16384).
- KeyDiff: ~0.4 (2048) → ~0.5 (4096) → ~0.6 (8192) → ~0.55 (16384).
- **OpenMath-Nemotron-14B (Solid Lines)**:
- Expected Attention: ~0.3 (2048) → ~0.4 (4096) → ~0.5 (8192) → ~0.55 (16384).
- Knorm: ~0.3 (2048) → ~0.4 (4096) → ~0.5 (8192) → ~0.55 (16384).
- Streaming LLM: ~0.4 (2048) → ~0.5 (4096) → ~0.6 (8192) → ~0.55 (16384).
- KeyDiff: ~0.5 (2048) → ~0.6 (4096) → ~0.7 (8192) → ~0.55 (16384).
### Key Observations
1. **KeyDiff (Purple)** consistently shows the highest scores, especially at 8192 tokens (~0.6), suggesting it is a critical metric for model performance.
2. **Knorm (Blue)** and **Streaming LLM (Orange)** exhibit steady growth with increasing context length, indicating scalability.
3. **Expected Attention (Red)** peaks at 4096 tokens but declines afterward, possibly due to computational constraints or model limitations.
4. **Larger models** (e.g., OpenMath-Nemotron-14B) outperform smaller models across all metrics, highlighting the impact of model size on performance.
5. **Dotted lines** (1.5B model) show the lowest scores, while **solid lines** (14B model) achieve the highest, emphasizing the correlation between model size and performance.
### Interpretation
The chart demonstrates that:
- **Model size** significantly influences performance, with larger models (e.g., OpenMath-Nemotron-14B) achieving higher scores across all metrics.
- **KeyDiff** is the most impactful metric, suggesting it may be a key factor in evaluating model effectiveness.
- **Context length** generally improves performance for most metrics, but some models (e.g., Expected Attention) plateau or decline at larger scales, possibly due to architectural or computational trade-offs.
- The **dotted and dashed lines** (smaller models) lag behind the **solid lines** (largest model), reinforcing the importance of model capacity in handling complex tasks.
This analysis underscores the trade-offs between model size, context length, and specific metrics in AI performance evaluation.