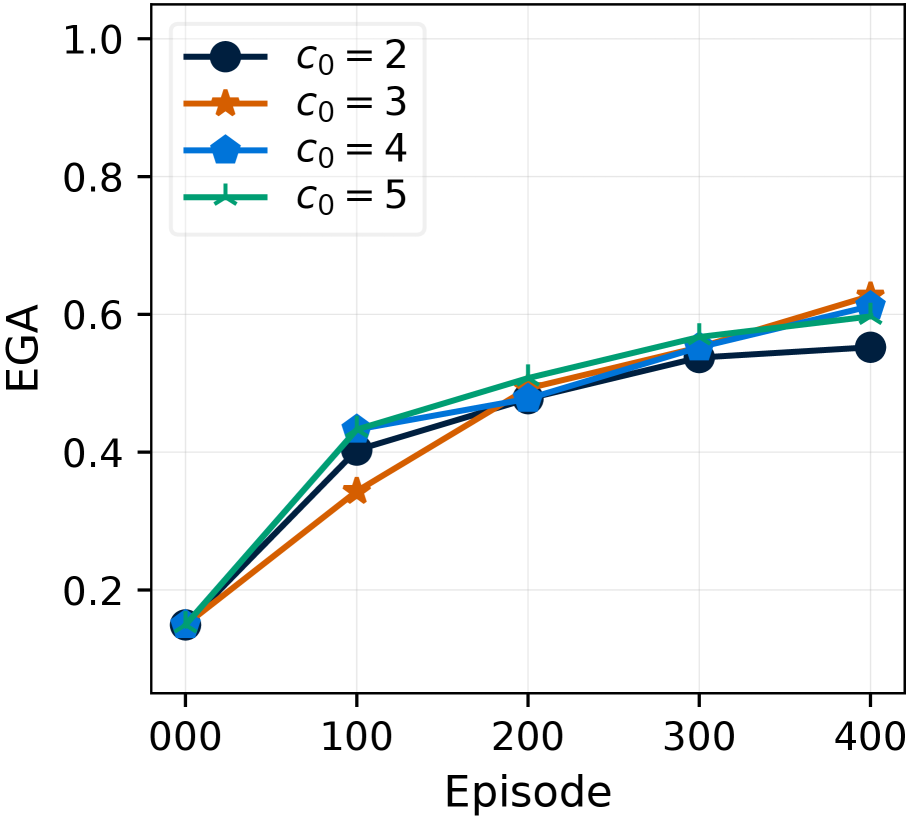
## Line Chart: EGA vs Episode for different c0 values
### Overview
The image is a line chart showing the relationship between EGA (Estimated Generalization Ability) and Episode number for four different values of a parameter 'c0'. The chart displays how EGA changes over the course of episodes for each c0 value.
### Components/Axes
* **X-axis (Horizontal):** Episode, with markers at 0, 100, 200, 300, and 400.
* **Y-axis (Vertical):** EGA, ranging from 0.0 to 1.0, with markers at 0.2, 0.4, 0.6, 0.8, and 1.0.
* **Legend (Top-Left):**
* Black line with circle marker: c0 = 2
* Orange line with star marker: c0 = 3
* Blue line with pentagon marker: c0 = 4
* Teal line with plus marker: c0 = 5
### Detailed Analysis
* **c0 = 2 (Black line, circle marker):**
* At Episode 0, EGA is approximately 0.15.
* At Episode 100, EGA is approximately 0.40.
* At Episode 200, EGA is approximately 0.48.
* At Episode 300, EGA is approximately 0.54.
* At Episode 400, EGA is approximately 0.56.
* Trend: The line slopes upward, with a decreasing rate of increase.
* **c0 = 3 (Orange line, star marker):**
* At Episode 0, EGA is approximately 0.15.
* At Episode 100, EGA is approximately 0.35.
* At Episode 200, EGA is approximately 0.50.
* At Episode 300, EGA is approximately 0.56.
* At Episode 400, EGA is approximately 0.63.
* Trend: The line slopes upward, with a decreasing rate of increase.
* **c0 = 4 (Blue line, pentagon marker):**
* At Episode 0, EGA is approximately 0.15.
* At Episode 100, EGA is approximately 0.43.
* At Episode 200, EGA is approximately 0.50.
* At Episode 300, EGA is approximately 0.56.
* At Episode 400, EGA is approximately 0.62.
* Trend: The line slopes upward, with a decreasing rate of increase.
* **c0 = 5 (Teal line, plus marker):**
* At Episode 0, EGA is approximately 0.15.
* At Episode 100, EGA is approximately 0.44.
* At Episode 200, EGA is approximately 0.51.
* At Episode 300, EGA is approximately 0.57.
* At Episode 400, EGA is approximately 0.60.
* Trend: The line slopes upward, with a decreasing rate of increase.
### Key Observations
* All lines start at approximately the same EGA value (0.15) at Episode 0.
* The EGA values for all c0 values increase as the number of episodes increases.
* The rate of increase in EGA decreases as the number of episodes increases.
* The lines for c0 = 3, c0 = 4, and c0 = 5 are relatively close to each other, while the line for c0 = 2 is slightly lower, especially at higher episode numbers.
### Interpretation
The chart suggests that increasing the number of episodes generally improves the Estimated Generalization Ability (EGA). However, the improvement diminishes over time, indicating a potential saturation point. The parameter 'c0' influences the EGA, with higher values of c0 (3, 4, and 5) resulting in slightly higher EGA values compared to c0 = 2, especially as the number of episodes increases. This implies that 'c0' plays a role in the learning process and its ability to generalize. The similarity in EGA trends for c0 = 3, 4, and 5 suggests that there might be a diminishing return in increasing 'c0' beyond a certain point.