## Line Chart: EGA vs. Episode for Different C0 Values
### Overview
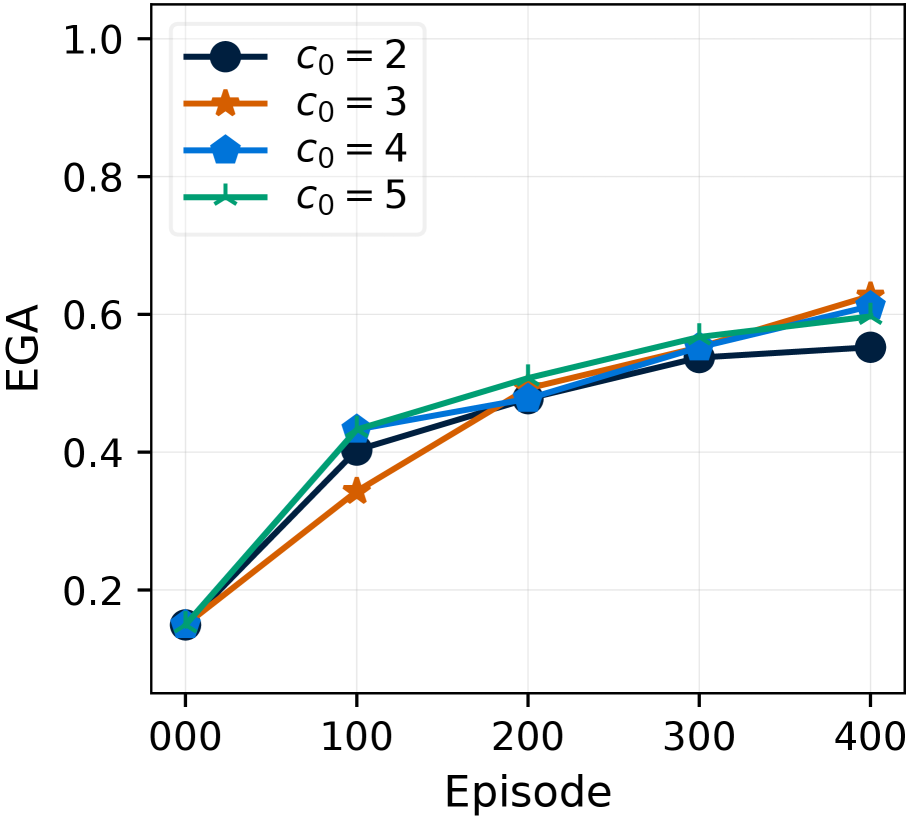
This image presents a line chart illustrating the relationship between Episode number and EGA (presumably a performance metric) for four different values of C0. The chart displays how EGA changes over the course of 400 episodes for each C0 value.
### Components/Axes
* **X-axis:** Episode, ranging from 0 to 400, with tick marks at 0, 100, 200, 300, and 400.
* **Y-axis:** EGA, ranging from 0 to 1.0, with tick marks at 0.2, 0.4, 0.6, 0.8, and 1.0.
* **Legend:** Located at the top-right of the chart, identifying four data series:
* C0 = 2 (Black circle)
* C0 = 3 (Orange triangle)
* C0 = 4 (Light blue diamond)
* C0 = 5 (Teal triangle)
* **Gridlines:** Light gray horizontal and vertical lines providing a visual reference for data point values.
### Detailed Analysis
The chart displays four distinct lines, each representing a different C0 value.
* **C0 = 2 (Black):** The line starts at approximately 0.17 at Episode 0, increases to around 0.44 at Episode 100, continues to approximately 0.52 at Episode 200, reaches about 0.56 at Episode 300, and ends at approximately 0.59 at Episode 400. The line exhibits a generally upward trend, with diminishing returns as the episode number increases.
* **C0 = 3 (Orange):** The line begins at approximately 0.13 at Episode 0, rises to around 0.38 at Episode 100, continues to approximately 0.48 at Episode 200, reaches about 0.54 at Episode 300, and ends at approximately 0.61 at Episode 400. This line also shows an upward trend, similar to C0 = 2, but generally starts lower and ends higher.
* **C0 = 4 (Light Blue):** The line starts at approximately 0.15 at Episode 0, increases to around 0.42 at Episode 100, continues to approximately 0.50 at Episode 200, reaches about 0.55 at Episode 300, and ends at approximately 0.58 at Episode 400. This line's trend is similar to the others, but it appears to plateau earlier than the other lines.
* **C0 = 5 (Teal):** The line begins at approximately 0.11 at Episode 0, rises to around 0.36 at Episode 100, continues to approximately 0.47 at Episode 200, reaches about 0.53 at Episode 300, and ends at approximately 0.57 at Episode 400. This line shows a similar upward trend, starting at the lowest EGA value and ending with a value between C0=4 and C0=2.
### Key Observations
* All four lines demonstrate an increasing trend in EGA as the episode number increases, suggesting that performance improves with more training or experience.
* The initial EGA values vary depending on the C0 value, with C0 = 2 starting with the highest EGA and C0 = 5 starting with the lowest.
* The lines converge as the episode number increases, indicating that the impact of C0 on EGA diminishes over time.
* C0 = 3 consistently shows the highest EGA values across most of the episodes.
### Interpretation
The chart suggests that the parameter C0 influences the initial performance (EGA) and the rate of improvement over episodes. Lower values of C0 (2 and 3) appear to lead to better initial performance, while higher values (4 and 5) require more episodes to reach comparable levels. The convergence of the lines indicates that, regardless of the initial C0 value, the system eventually reaches a similar level of performance after sufficient training (400 episodes in this case). This could imply that C0 primarily affects the learning speed or initial conditions, but not the ultimate performance limit. The data suggests that C0 = 3 provides the best overall performance, achieving the highest EGA values throughout the observed episode range. Further investigation might be needed to understand the specific role of C0 and why it impacts EGA in this manner.