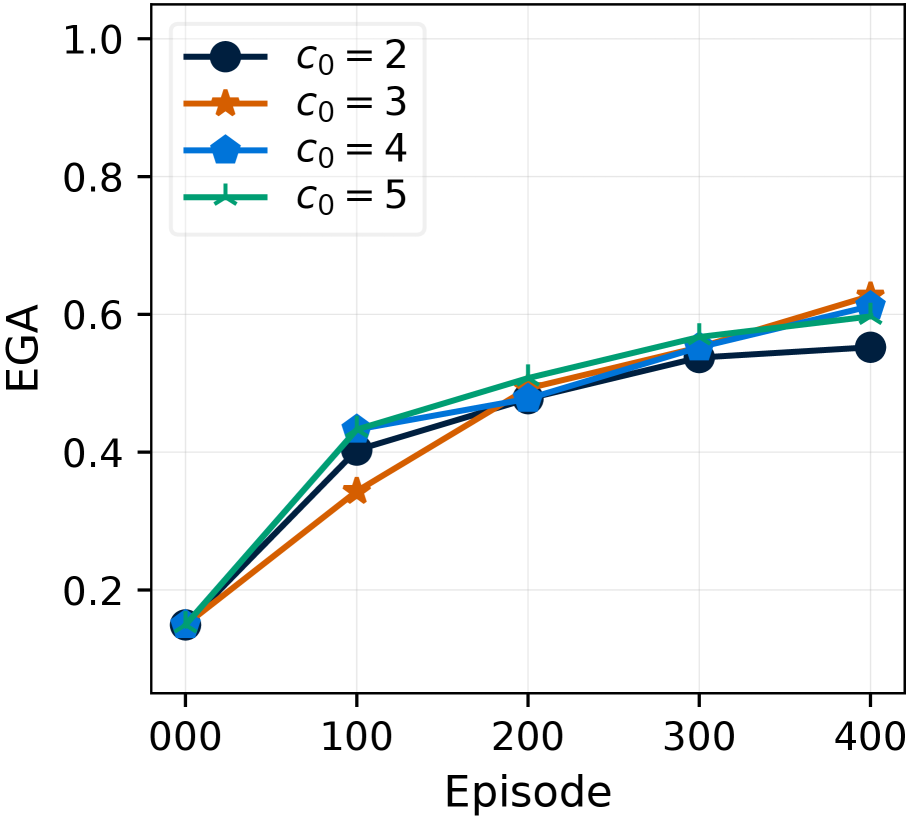
## Line Chart: EGA Performance Across Episodes
### Overview
The chart illustrates the evolution of EGA (Expected Gain Accuracy) across 400 episodes for four distinct configurations (c₀ = 2, 3, 4, 5). All lines originate from the same starting point (0, 0.15) but diverge significantly by episode 400, demonstrating configuration-dependent performance trends.
### Components/Axes
- **X-axis (Episode)**: Discrete increments from 0 to 400 (steps of 100).
- **Y-axis (EGA)**: Continuous scale from 0.0 to 1.0 (steps of 0.2).
- **Legend**: Top-left corner, mapping:
- Black circle: c₀ = 2
- Orange star: c₀ = 3
- Blue pentagon: c₀ = 4
- Green cross: c₀ = 5
### Detailed Analysis
1. **c₀ = 2 (Black Circle)**:
- Starts at (0, 0.15).
- Gradual upward slope, reaching ~0.57 at episode 400.
- Slowest growth rate among all configurations.
2. **c₀ = 3 (Orange Star)**:
- Starts at (0, 0.15).
- Steeper initial ascent than c₀ = 2, peaking at ~0.63 by episode 400.
- Crosses c₀ = 4 line near episode 200.
3. **c₀ = 4 (Blue Pentagon)**:
- Starts at (0, 0.15).
- Highest growth rate initially, surpassing c₀ = 3 by episode 100.
- Peaks at ~0.62 by episode 400.
4. **c₀ = 5 (Green Cross)**:
- Starts at (0, 0.15).
- Consistently highest EGA across all episodes.
- Reaches ~0.61 by episode 400, maintaining lead over c₀ = 4.
### Key Observations
- **Divergence Pattern**: All lines converge at (0, 0.15) but separate sharply after episode 100.
- **Configuration Impact**: Higher c₀ values correlate with higher EGA (c₀ = 5 > c₀ = 4 > c₀ = 3 > c₀ = 2).
- **Crossing Behavior**: c₀ = 3 and c₀ = 4 intersect near episode 200, suggesting transient performance parity.
- **Asymptotic Behavior**: EGA plateaus near 0.6 for all configurations by episode 400.
### Interpretation
The data suggests that increasing c₀ improves EGA performance, with diminishing returns observed as c₀ approaches 5. The crossing of c₀ = 3 and c₀ = 4 lines implies that intermediate configurations may exhibit non-monotonic trade-offs. The consistent lead of c₀ = 5 indicates it optimizes EGA most effectively, though the marginal gain over c₀ = 4 (0.01 difference at episode 400) questions its practical significance. This pattern could reflect algorithmic sensitivity to hyperparameters in reinforcement learning or optimization systems, where higher c₀ values might better balance exploration/exploitation or model complexity.