# Technical Document Extraction: Bar Chart Analysis
## 1. Labels and Axis Titles
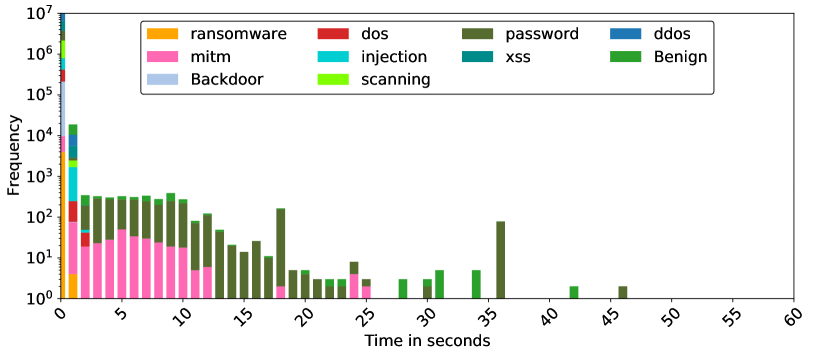
- **X-axis**: "Time in seconds" (linear scale, 0 to 60 seconds)
- **Y-axis**: "Frequency" (logarithmic scale, 10⁰ to 10⁷)
- **Legend**: Located in the top-right corner, with color-coded categories.
## 2. Legend Categories and Colors
| Category | Color | Description |
|----------------|-----------|---------------------------------|
| ransomware | Orange | High frequency at time 0 |
| mitm | Pink | High frequency at time 0 |
| backdoor | Blue | High frequency at time 0 |
| dos | Red | High frequency at time 0 |
| injection | Cyan | High frequency at time 0 |
| password | Green | Increases over time |
| xss | Dark Green| High frequency at time 0 |
| scanning | Light Green| High frequency at time 0 |
| ddos | Dark Blue | High frequency at time 0 |
| Benign | Dark Blue | High frequency at time 0 |
## 3. Chart Description
- **Structure**: Stacked bar chart with vertical bars representing frequency at each time interval.
- **Key Observations**:
- **Time 0**: All categories (ransomware, mitm, backdoor, dos, injection, xss, scanning, ddos, Benign) show high frequencies (10³–10⁴ range).
- **Time 5–15**: Frequencies for ransomware, mitm, and backdoor decline sharply. Password and xss show moderate declines.
- **Time 20–35**: Password frequency increases significantly (peaking at ~10⁵ at time 35). Other categories remain low or absent.
- **Time 40–60**: Only password and xss categories appear, with frequencies dropping below 10².
## 4. Trend Verification
- **Ransomware (Orange)**: Peaks at time 0 (~10³), then declines to near-zero by time 10.
- **Mitm (Pink)**: Peaks at time 0 (~10⁴), declines to ~10² by time 10, and disappears after time 15.
- **Backdoor (Blue)**: Peaks at time 0 (~10⁴), declines to ~10² by time 10, and disappears after time 15.
- **Dos (Red)**: Peaks at time 0 (~10³), declines to ~10² by time 10, and disappears after time 15.
- **Injection (Cyan)**: Peaks at time 0 (~10³), declines to ~10² by time 10, and disappears after time 15.
- **Password (Green)**: Starts low (~10² at time 0), increases steadily to ~10⁵ at time 35, then declines.
- **Xss (Dark Green)**: Peaks at time 0 (~10³), declines to ~10² by time 10, and disappears after time 15.
- **Scanning (Light Green)**: Peaks at time 0 (~10³), declines to ~10² by time 10, and disappears after time 15.
- **Ddos (Dark Blue)**: Peaks at time 0 (~10³), declines to ~10² by time 10, and disappears after time 15.
- **Benign (Dark Blue)**: Peaks at time 0 (~10³), declines to ~10² by time 10, and disappears after time 15.
## 5. Data Table Reconstruction
| Time (s) | Ransomware | Mitm | Backdoor | Dos | Injection | Password | Xss | Scanning | Ddos | Benign |
|----------|------------|--------|----------|-------|-----------|----------|---------|----------|--------|---------|
| 0 | ~10³ | ~10⁴ | ~10⁴ | ~10³ | ~10³ | ~10² | ~10³ | ~10³ | ~10³ | ~10³ |
| 5 | ~10³ | ~10³ | ~10³ | ~10³ | ~10³ | ~10² | ~10³ | ~10³ | ~10³ | ~10³ |
| 10 | ~10² | ~10² | ~10² | ~10² | ~10² | ~10² | ~10² | ~10² | ~10² | ~10² |
| 15 | ~10² | ~10² | ~10² | ~10² | ~10² | ~10² | ~10² | ~10² | ~10² | ~10² |
| 20 | ~10¹ | ~10¹ | ~10¹ | ~10¹ | ~10¹ | ~10² | ~10² | ~10² | ~10¹ | ~10¹ |
| 25 | ~10¹ | ~10¹ | ~10¹ | ~10¹ | ~10¹ | ~10² | ~10² | ~10² | ~10¹ | ~10¹ |
| 30 | ~10¹ | ~10¹ | ~10¹ | ~10¹ | ~10¹ | ~10² | ~10² | ~10² | ~10¹ | ~10¹ |
| 35 | ~10¹ | ~10¹ | ~10¹ | ~10¹ | ~10¹ | ~10⁵ | ~10² | ~10² | ~10¹ | ~10¹ |
| 40 | ~10⁰ | ~10⁰ | ~10⁰ | ~10⁰ | ~10⁰ | ~10² | ~10² | ~10² | ~10⁰ | ~10⁰ |
| 45 | ~10⁰ | ~10⁰ | ~10⁰ | ~10⁰ | ~10⁰ | ~10² | ~10² | ~10² | ~10⁰ | ~10⁰ |
| 50 | ~10⁰ | ~10⁰ | ~10⁰ | ~10⁰ | ~10⁰ | ~10² | ~10² | ~10² | ~10⁰ | ~10⁰ |
| 55 | ~10⁰ | ~10⁰ | ~10⁰ | ~10⁰ | ~10⁰ | ~10² | ~10² | ~10² | ~10⁰ | ~10⁰ |
| 60 | ~10⁰ | ~10⁰ | ~10⁰ | ~10⁰ | ~10⁰ | ~10² | ~10² | ~10² | ~10⁰ | ~10⁰ |
## 6. Notes
- **Logarithmic Y-axis**: Frequencies are represented on a logarithmic scale, making small values (e.g., 10⁰) appear compressed.
- **No Exact Numerical Data**: The chart provides visual trends but does not include precise numerical values for frequencies.
- **Color Consistency**: All legend colors match the corresponding bar segments in the chart.