# Technical Document Extraction: Network Traffic Attack Frequency Analysis
## 1. Image Overview
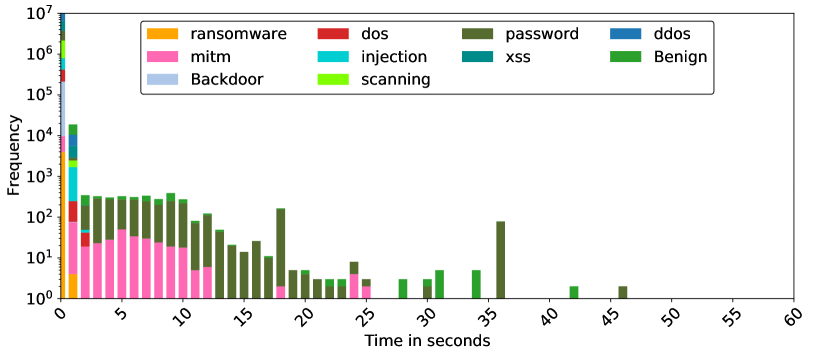
This image is a **stacked histogram** representing the frequency of various network traffic types (both malicious and benign) over a duration of time measured in seconds. The Y-axis uses a logarithmic scale to accommodate a wide range of frequency values, from single occurrences to millions.
## 2. Component Isolation
### A. Header / Legend
* **Location:** Top center, enclosed in a rounded rectangle.
* **Categories (11 total):**
* **Orange:** ransomware
* **Pink:** mitm (Man-in-the-Middle)
* **Light Blue:** Backdoor
* **Red:** dos (Denial of Service)
* **Cyan:** injection
* **Lime Green:** scanning
* **Dark Olive Green:** password
* **Teal:** xss (Cross-Site Scripting)
* **Dark Blue:** ddos (Distributed Denial of Service)
* **Green:** Benign
### B. Main Chart Area (Axes)
* **Y-Axis (Vertical):**
* **Label:** Frequency
* **Scale:** Logarithmic ($10^0$ to $10^7$)
* **Markers:** $10^0, 10^1, 10^2, 10^3, 10^4, 10^5, 10^6, 10^7$
* **X-Axis (Horizontal):**
* **Label:** Time in seconds
* **Range:** 0 to 60 seconds
* **Markers:** 0, 5, 10, 15, 20, 25, 30, 35, 40, 45, 50, 55, 60 (labeled at 5-second intervals, rotated 45 degrees).
## 3. Data Analysis and Trends
### General Distribution
The vast majority of data points are concentrated at the **0-second mark**, where the frequency for almost all categories peaks significantly (reaching up to $10^7$). As time increases, the frequency drops sharply, following a long-tail distribution.
### Category-Specific Trends
| Category | Color | Visual Trend & Data Points |
| :--- | :--- | :--- |
| **Benign** | Green | Highest frequency at $t=0$ (approx. $10^7$). Appears sporadically across the timeline (e.g., at 30s, 35s, 42s) with low frequency ($\approx 10^0 - 10^1$). |
| **password** | Dark Olive Green | Significant presence between 2s and 12s (frequency $\approx 10^2$). Notable spike at 18s and 36s. This is the most persistent category across the 15-40s range. |
| **mitm** | Pink | Concentrated in the 0s to 12s range. Frequency starts high at 0s ($\approx 10^4$), maintains a plateau of $\approx 10^1 - 10^2$ until 12s, then disappears. |
| **ransomware** | Orange | Only visible at $t=0$ with a frequency of approx. $10^3 - 10^4$. |
| **dos** | Red | Visible at $t=0$ (approx. $10^5$) and a small sliver at $t=2$. |
| **injection** | Cyan | Visible at $t=0$ (approx. $10^5$) and a small sliver at $t=2$. |
| **scanning** | Lime Green | Visible at $t=0$ (approx. $10^6$) and $t=1$ (approx. $10^3$). |
| **ddos** | Dark Blue | Visible at $t=0$ (approx. $10^6$) and $t=1$ (approx. $10^4$). |
| **Backdoor** | Light Blue | Visible primarily at $t=0$ (approx. $10^5$). |
| **xss** | Teal | Visible at $t=0$ (approx. $10^5$) and $t=1$ (approx. $10^3$). |
## 4. Key Observations
1. **Instantaneous Events:** The $t=0$ bin contains the bulk of all traffic types, suggesting many network events or attacks are logged with a near-zero duration or occur within the first second.
2. **Persistent Attacks:** "Password" and "mitm" attacks show a distinct temporal signature, lasting significantly longer (up to 12-36 seconds) compared to "ransomware" or "dos" which are strictly short-duration in this dataset.
3. **Sparsity:** Beyond 45 seconds, there is virtually no recorded activity in any category.