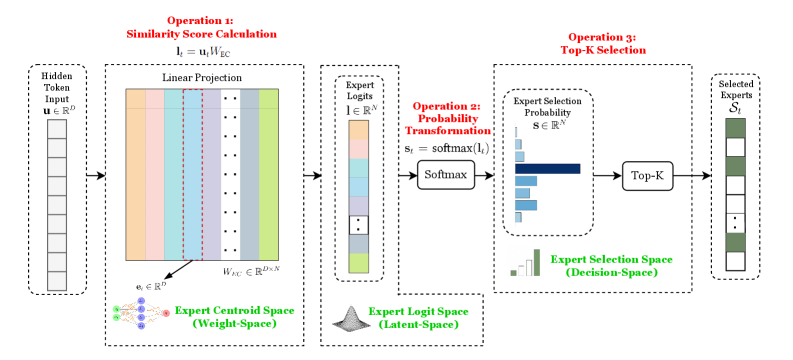
## Diagram: Expert Selection Process
### Overview
The image is a diagram illustrating a three-step process for expert selection. It starts with a hidden token input, calculates similarity scores, transforms these into probabilities, and then selects the top-K experts.
### Components/Axes
* **Operation 1: Similarity Score Calculation**
* Formula: lₜ = uₜWₑc
* Input: Hidden Token Input (u ∈ Rᴰ)
* Process: Linear Projection
* Matrix: Wₑc ∈ Rᴰˣᴺ
* Expert Centroid Space (Weight-Space): Represented by a neural network diagram.
* **Operation 2: Probability Transformation**
* Input: Expert Logits (l ∈ Rᴺ)
* Process: Softmax (sₜ = softmax(lₜ))
* Output: Expert Selection Probability (s ∈ Rᴺ)
* Expert Logit Space (Latent-Space): Represented by a 3D Gaussian-like shape.
* **Operation 3: Top-K Selection**
* Input: Expert Selection Probability (s ∈ Rᴺ)
* Process: Top-K selection
* Output: Selected Experts (Sₜ)
* Expert Selection Space (Decision-Space): Represented by a bar chart.
### Detailed Analysis
* **Hidden Token Input:** A column of 8 gray boxes, representing the input vector u ∈ Rᴰ.
* **Linear Projection:** A matrix with N columns, each column represented by a different color (orange, pink, light blue, green, light green, purple, gray). Each column has multiple dots, suggesting a high dimensionality.
* **Expert Logits:** A column of N boxes, each corresponding to an expert. The boxes are colored similarly to the columns in the Linear Projection matrix.
* **Softmax:** A box labeled "Softmax" representing the softmax function.
* **Expert Selection Probability:** A bar chart with N bars, representing the probability of each expert being selected. The bars are in shades of blue, with the tallest bar being dark blue.
* **Top-K Selection:** A box labeled "Top-K" representing the top-K selection process.
* **Selected Experts:** A column of boxes, some filled with a dark green color, representing the selected experts Sₜ.
### Key Observations
* The diagram illustrates a clear flow from input to selected experts.
* The color-coding in the Linear Projection and Expert Logits suggests a correspondence between the experts and the columns in the matrix.
* The Softmax function transforms the logits into probabilities, which are then used for expert selection.
* The Expert Selection Space (Decision-Space) visually represents the selection process.
### Interpretation
The diagram depicts a mechanism for selecting experts based on the similarity between a hidden token input and expert centroids. The process involves calculating similarity scores through linear projection, transforming these scores into probabilities using the softmax function, and then selecting the top-K experts based on these probabilities. The diagram highlights the transformation of the input from a high-dimensional space (Rᴰ) to a probability distribution over experts (Rᴺ), ultimately leading to the selection of a subset of experts (Sₜ). The use of different spaces (Weight-Space, Latent-Space, Decision-Space) suggests a multi-faceted approach to expert representation and selection.