## Line Chart: Validation Accuracy
### Overview
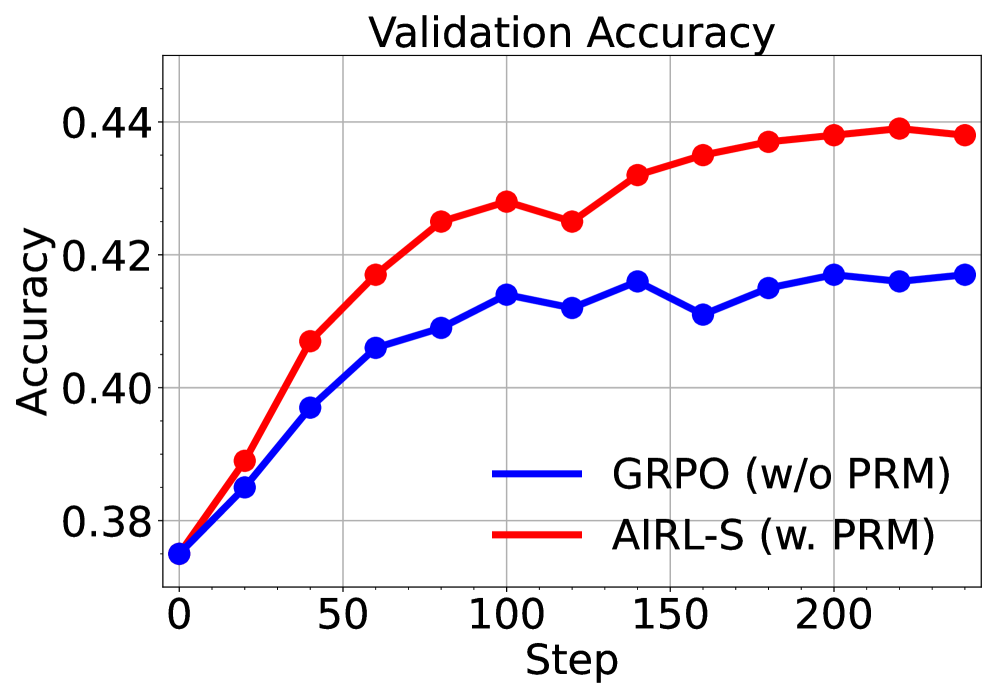
The image is a line chart comparing the validation accuracy of two algorithms, GRPO (w/o PRM) and AIRL-S (w. PRM), over a series of steps. The chart displays accuracy on the y-axis and steps on the x-axis.
### Components/Axes
* **Title:** Validation Accuracy
* **X-axis:**
* Label: Step
* Scale: 0 to 200, with markers at 0, 50, 100, 150, and 200.
* **Y-axis:**
* Label: Accuracy
* Scale: 0.38 to 0.44, with markers at 0.38, 0.40, 0.42, and 0.44.
* **Legend:** Located in the bottom-right corner.
* Blue line: GRPO (w/o PRM)
* Red line: AIRL-S (w. PRM)
### Detailed Analysis
* **GRPO (w/o PRM) - Blue Line:**
* Trend: Initially increases, plateaus, then fluctuates slightly.
* Data Points:
* Step 0: Accuracy ~0.375
* Step 50: Accuracy ~0.405
* Step 100: Accuracy ~0.41
* Step 150: Accuracy ~0.415
* Step 200: Accuracy ~0.417
* **AIRL-S (w. PRM) - Red Line:**
* Trend: Increases rapidly initially, then plateaus at a higher accuracy.
* Data Points:
* Step 0: Accuracy ~0.375
* Step 50: Accuracy ~0.418
* Step 100: Accuracy ~0.427
* Step 150: Accuracy ~0.433
* Step 200: Accuracy ~0.439
### Key Observations
* Both algorithms start with approximately the same accuracy (~0.375).
* AIRL-S (w. PRM) consistently outperforms GRPO (w/o PRM) in terms of validation accuracy.
* The accuracy of AIRL-S (w. PRM) plateaus more noticeably than GRPO (w/o PRM).
### Interpretation
The chart suggests that the AIRL-S algorithm, when used with PRM, achieves a higher validation accuracy compared to the GRPO algorithm without PRM. The initial rapid increase in accuracy for AIRL-S indicates a faster learning rate or better initial performance. The plateauing of both lines suggests that further training steps may not significantly improve the validation accuracy for either algorithm. The PRM component seems to be a significant factor in the performance difference between the two algorithms.