\n
## Diagram: Floor Plan with Object Locations
### Overview
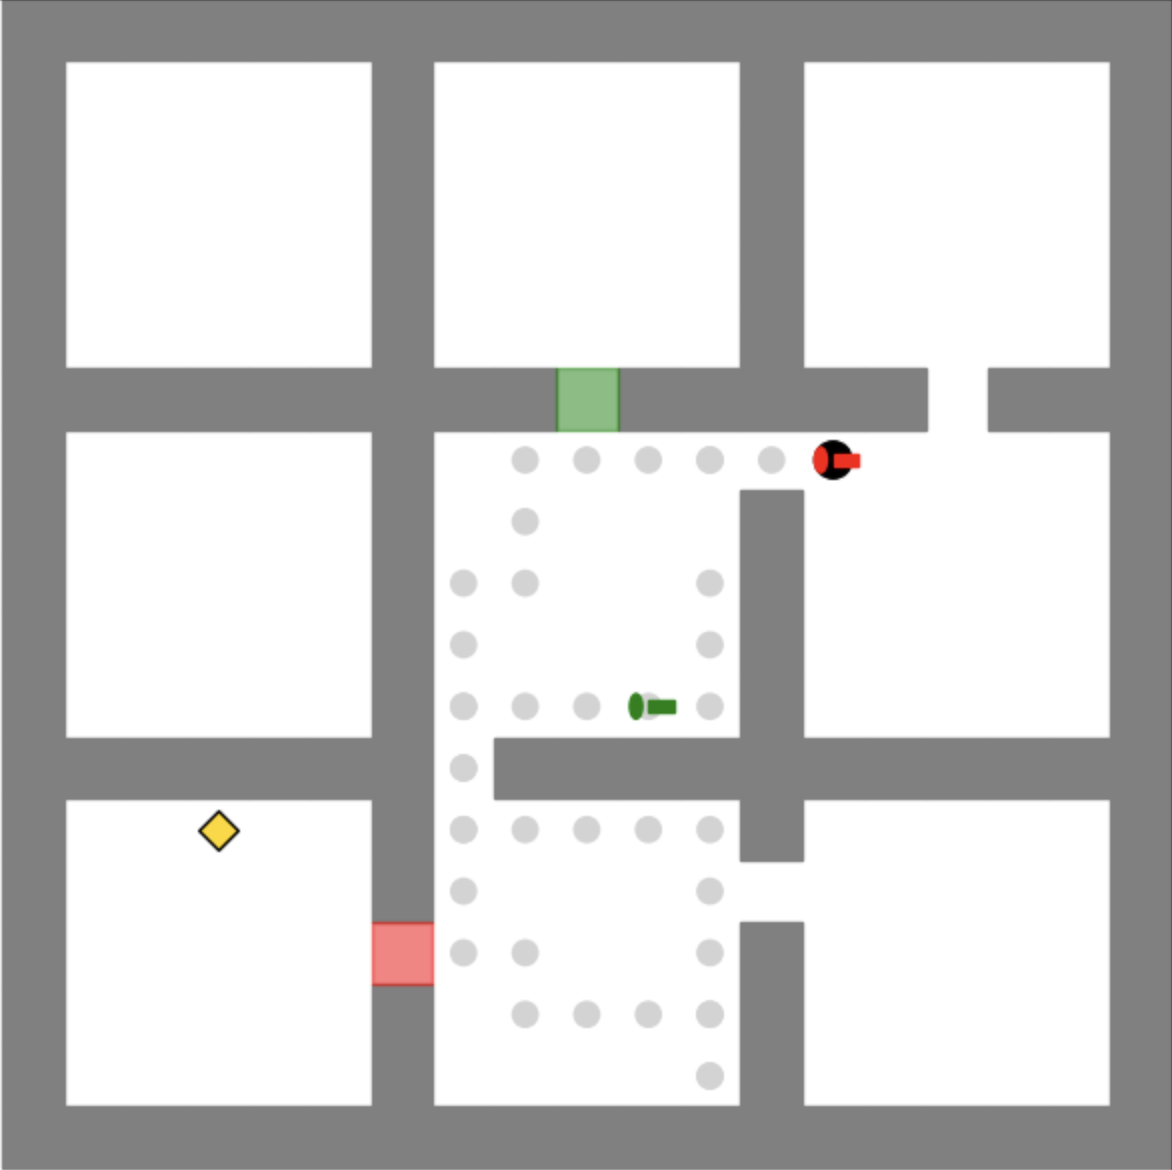
The image depicts a simplified floor plan, likely of a building or complex, represented in a top-down view. The floor plan is composed of interconnected rectangular spaces separated by gray walls. Several colored shapes are positioned within the floor plan, presumably representing objects or entities. There are no axes or scales present. The diagram appears to be a visual representation of a state or configuration, rather than a dynamic process.
### Components/Axes
The diagram consists of:
* **Walls:** Gray rectangular shapes defining the boundaries of rooms and corridors.
* **Rooms/Spaces:** White rectangular areas enclosed by walls.
* **Objects:** Colored shapes (red, green, black, and yellow) positioned within the floor plan.
* **Gray Dots:** Scattered throughout the floor plan, possibly representing a grid or texture.
There are no explicit labels or axes.
### Detailed Analysis or Content Details
The following objects are present, with approximate locations described relative to the floor plan's overall structure:
* **Red Square:** Located in the bottom-left quadrant of the floor plan, within a rectangular room.
* **Green Square:** Located in the top-center quadrant, within a rectangular room.
* **Black Circle with Red Dot:** Located in the top-right quadrant, within a smaller rectangular space connected to a larger central area.
* **Yellow Diamond:** Located in the bottom-left quadrant, in a separate rectangular room.
* **Green Rectangle:** Located in the center of the floor plan, within the large central area.
The gray dots are distributed throughout the central area and the rooms connected to it. They do not appear to form any specific pattern or represent any quantifiable data.
### Key Observations
* The floor plan is symmetrical in its overall structure, with a large central area connected to several smaller rooms.
* The objects are distributed throughout the floor plan, with no obvious clustering or pattern.
* The red square and yellow diamond are both located in the bottom-left quadrant, but in separate rooms.
* The black circle with a red dot is the only object with multiple visual components.
### Interpretation
The diagram likely represents a simplified map or layout, potentially for a game, simulation, or security system. The colored shapes could represent agents, targets, or points of interest. The lack of labels or scales suggests that the diagram is intended for qualitative understanding rather than precise measurement.
The distribution of objects may indicate a scenario or state within the system. For example, the red square could represent an enemy, the green squares could represent allies, and the black circle with a red dot could represent a critical objective. The gray dots could represent obstacles or areas of limited visibility.
Without additional context, it is difficult to determine the specific meaning of the diagram. However, it clearly conveys a spatial relationship between different elements within a defined environment. The diagram's simplicity suggests that it is intended to be easily understood and interpreted, even without detailed knowledge of the underlying system. The arrangement of the objects could be a snapshot of a dynamic situation, or a planned configuration. The presence of the red dot within the black circle could signify a vulnerability or a point of attention.