## Bar Chart and Data Table: Legal Sector IT Spending and Income
### Overview
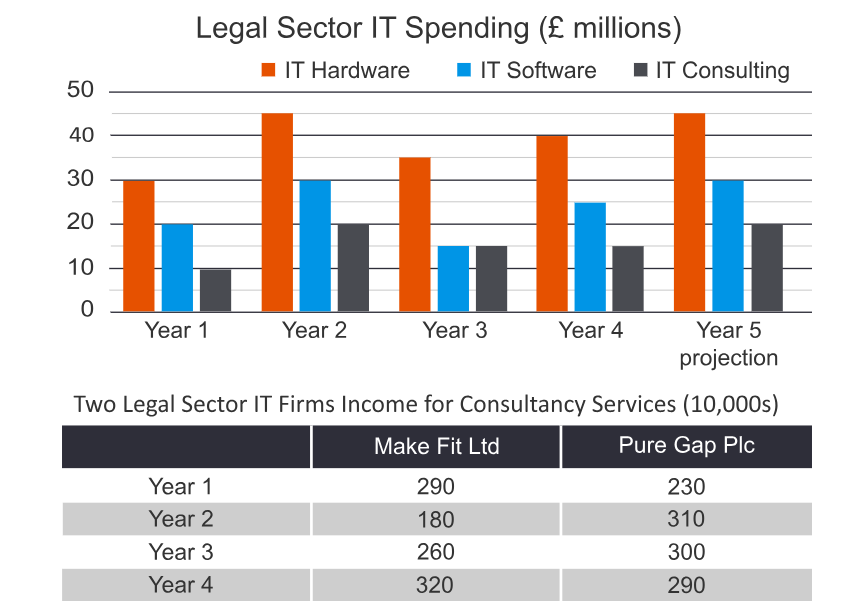
The image presents two distinct data visualizations regarding the legal sector. The top section is a grouped bar chart illustrating IT spending across three categories (Hardware, Software, Consulting) over a five-year period. The bottom section is a data table comparing the consultancy income of two specific firms, "Make Fit Ltd" and "Pure Gap Plc," over a four-year period.
### Components/Axes
**Top Chart: Legal Sector IT Spending**
* **Title:** Legal Sector IT Spending (£ millions)
* **Y-Axis:** Represents spending in millions of pounds (£), scaled from 0 to 50 in increments of 10.
* **X-Axis:** Represents time, labeled "Year 1" through "Year 5 projection."
* **Legend (Top-Center):**
* **Orange:** IT Hardware
* **Blue:** IT Software
* **Dark Grey:** IT Consulting
**Bottom Table: Two Legal Sector IT Firms Income**
* **Title:** Two Legal Sector IT Firms Income for Consultancy Services (10,000s)
* **Columns:** "Make Fit Ltd" and "Pure Gap Plc"
* **Rows:** Year 1, Year 2, Year 3, Year 4
* **Unit:** The values are in 10,000s.
---
### Detailed Analysis
#### 1. Legal Sector IT Spending (Bar Chart)
*Trend Verification:* Across all categories, spending generally follows a pattern of peaking in Year 2, dipping in Year 3, and recovering toward Year 5.
* **Year 1:**
* IT Hardware (Orange): ~30
* IT Software (Blue): ~20
* IT Consulting (Dark Grey): ~10
* **Year 2:**
* IT Hardware (Orange): ~45
* IT Software (Blue): ~30
* IT Consulting (Dark Grey): ~20
* **Year 3:**
* IT Hardware (Orange): ~35
* IT Software (Blue): ~15
* IT Consulting (Dark Grey): ~15
* **Year 4:**
* IT Hardware (Orange): ~40
* IT Software (Blue): ~25
* IT Consulting (Dark Grey): ~15
* **Year 5 (Projection):**
* IT Hardware (Orange): ~45
* IT Software (Blue): ~30
* IT Consulting (Dark Grey): ~20
#### 2. Consultancy Income Table
| Year | Make Fit Ltd (10,000s) | Make Fit Ltd (Actual) | Pure Gap Plc (10,000s) | Pure Gap Plc (Actual) |
| :--- | :--- | :--- | :--- | :--- |
| Year 1 | 290 | 2,900,000 | 230 | 2,300,000 |
| Year 2 | 180 | 1,800,000 | 310 | 3,100,000 |
| Year 3 | 260 | 2,600,000 | 300 | 3,000,000 |
| Year 4 | 320 | 3,200,000 | 290 | 2,900,000 |
---
### Key Observations
* **Chart Symmetry:** The spending profile for Year 5 (projection) is identical to the actual spending in Year 2.
* **Sector Volatility:** Year 3 represents a local minimum for all three IT spending categories, suggesting a potential market contraction or a cycle of hardware/software refresh that hit a lull.
* **Table Divergence:** The two firms show inverse performance trends. Make Fit Ltd experienced a sharp decline in Year 2, followed by a strong recovery. Conversely, Pure Gap Plc peaked in Year 2 and has experienced a steady, slight decline since.
### Interpretation
The data suggests a cyclical nature to IT spending within the legal sector, with significant fluctuations in hardware and software investment. The "Year 5 projection" indicates an expectation of returning to the high-spending levels seen in Year 2.
Regarding the firm-specific income, there is a clear competitive shift. Make Fit Ltd appears to have recovered from a significant operational or market setback in Year 2, ending Year 4 as the higher-earning firm (320 vs 290). Pure Gap Plc, while initially outperforming Make Fit Ltd in Years 2 and 3, shows a trend of diminishing returns, potentially indicating a loss of market share to competitors like Make Fit Ltd or a general saturation in their specific service niche.