\n
## Bar Chart: Legal Sector IT Spending & Consultancy Income
### Overview
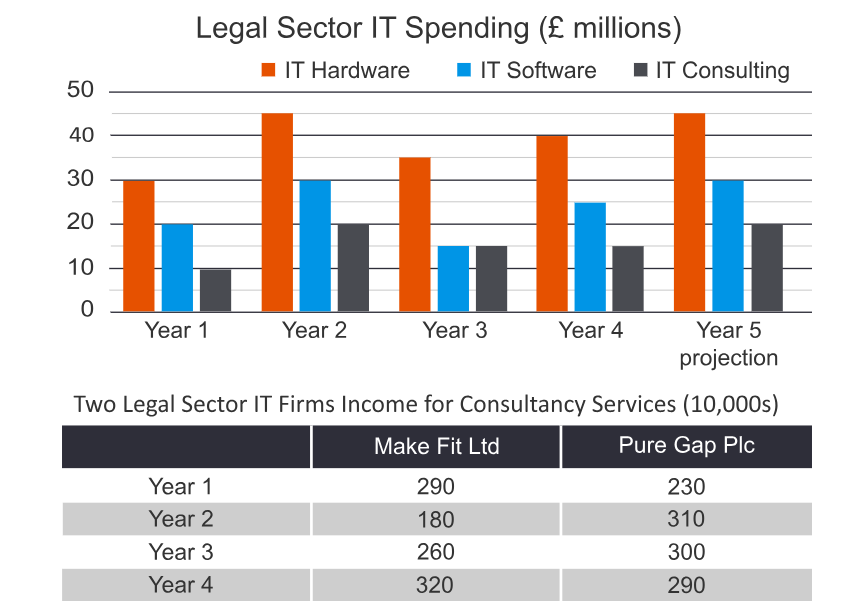
The image presents two distinct data visualizations. The upper portion is a bar chart illustrating IT spending in the legal sector (in £ millions) across five years, categorized by IT Hardware, IT Software, and IT Consulting. The lower portion is a data table showing the income (in 10,000s) for two IT firms, Make Fit Ltd and Pure Gap Plc, over four years.
### Components/Axes
**Bar Chart:**
* **Title:** "Legal Sector IT Spending (£ millions)"
* **X-axis:** Years (Year 1, Year 2, Year 3, Year 4, Year 5 projection)
* **Y-axis:** Spending (£ millions), ranging from 0 to 50.
* **Legend:**
* IT Hardware (Red)
* IT Software (Blue)
* IT Consulting (Black)
**Data Table:**
* **Title:** "Two Legal Sector IT Firms Income (10,000s)"
* **Rows:** Years (Year 1, Year 2, Year 3, Year 4)
* **Columns:** Firms (Make Fit Ltd, Pure Gap Plc)
### Detailed Analysis or Content Details
**Bar Chart Analysis:**
* **IT Hardware (Red):** The trend slopes upward over the five years.
* Year 1: Approximately 31 million £
* Year 2: Approximately 40 million £
* Year 3: Approximately 34 million £
* Year 4: Approximately 38 million £
* Year 5 (projection): Approximately 43 million £
* **IT Software (Blue):** The trend is relatively stable with a slight increase.
* Year 1: Approximately 17 million £
* Year 2: Approximately 28 million £
* Year 3: Approximately 22 million £
* Year 4: Approximately 24 million £
* Year 5 (projection): Approximately 30 million £
* **IT Consulting (Black):** The trend shows a moderate increase.
* Year 1: Approximately 8 million £
* Year 2: Approximately 20 million £
* Year 3: Approximately 14 million £
* Year 4: Approximately 17 million £
* Year 5 (projection): Approximately 22 million £
**Data Table Analysis:**
| Year | Make Fit Ltd (10,000s) | Pure Gap Plc (10,000s) |
|---|---|---|
| Year 1 | 290 | 230 |
| Year 2 | 180 | 310 |
| Year 3 | 260 | 300 |
| Year 4 | 320 | 290 |
### Key Observations
* IT Hardware consistently represents the largest portion of IT spending in the legal sector.
* IT Software spending shows a significant jump in Year 2, then stabilizes.
* IT Consulting spending is the lowest among the three categories but shows steady growth.
* Make Fit Ltd generally has lower income than Pure Gap Plc in Year 1 and Year 2, but surpasses it in Year 4.
* Pure Gap Plc experiences a peak in income in Year 2.
### Interpretation
The data suggests a growing investment in IT within the legal sector, particularly in hardware. The projection for Year 5 indicates continued growth in all three spending categories. The fluctuations in software spending might be attributed to specific project implementations or licensing cycles. The consultancy income data reveals differing performance trajectories for the two firms, potentially reflecting their market positioning, service offerings, or client base. The correlation between the overall IT spending and the consultancy income could indicate that increased IT investment drives demand for consulting services. The divergence in firm performance suggests a competitive landscape where firms need to adapt to changing market dynamics to maintain or improve their income. The data does not provide information on the *reasons* for these trends, only the trends themselves. Further investigation would be needed to understand the underlying drivers of these changes.