## Bar Chart: Legal Sector IT Spending (£ millions)
### Overview
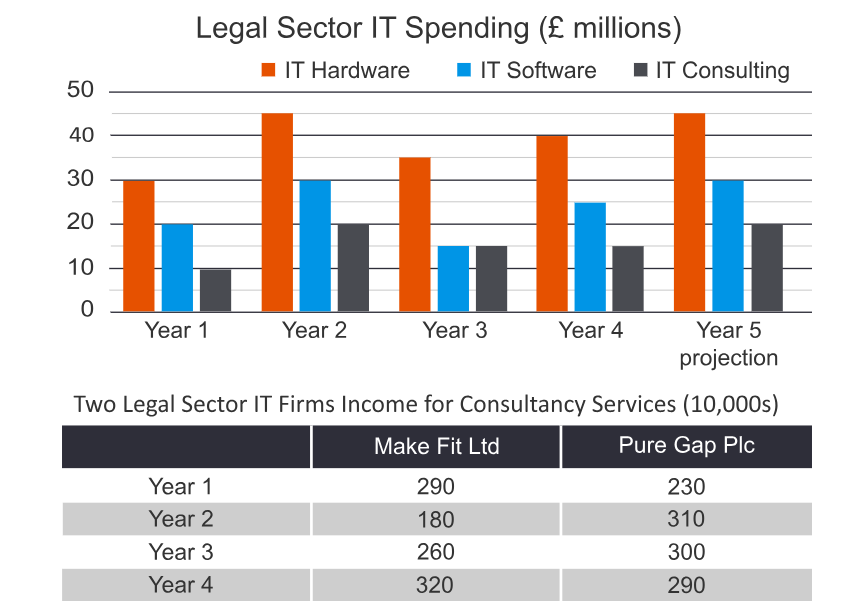
The image contains a bar chart titled "Legal Sector IT Spending (£ millions)" and a table titled "Two Legal Sector IT Firms Income for Consultancy Services (10,000s)". The chart visualizes spending trends across three IT categories (Hardware, Software, Consulting) over five years, with Year 5 marked as a projection. The table compares income data for two firms: Make Fit Ltd and Pure Gap Plc.
### Components/Axes
- **Chart Elements**:
- **X-axis**: Years labeled "Year 1" to "Year 5 projection".
- **Y-axis**: Spending in £ millions, ranging from 0 to 50.
- **Legend**: Located at the top-right, with color-coded categories:
- **Orange**: IT Hardware
- **Blue**: IT Software
- **Gray**: IT Consulting
- **Table Elements**:
- **Columns**: Years 1–4, with two firms:
- **Make Fit Ltd** (left column)
- **Pure Gap Plc** (right column)
- **Values**: Income in 10,000s (e.g., 290 = £2.9 million).
### Detailed Analysis
#### Chart Data (Approximate Values):
- **Year 1**:
- IT Hardware: ~30 million
- IT Software: ~20 million
- IT Consulting: ~10 million
- **Year 2**:
- IT Hardware: ~45 million
- IT Software: ~30 million
- IT Consulting: ~20 million
- **Year 3**:
- IT Hardware: ~35 million
- IT Software: ~15 million
- IT Consulting: ~15 million
- **Year 4**:
- IT Hardware: ~40 million
- IT Software: ~25 million
- IT Consulting: ~15 million
- **Year 5 (Projection)**:
- IT Hardware: ~45 million
- IT Software: ~30 million
- IT Consulting: ~20 million
#### Table Data:
| Year | Make Fit Ltd | Pure Gap Plc |
|------|--------------|--------------|
| Year 1 | 290 | 230 |
| Year 2 | 180 | 310 |
| Year 3 | 260 | 300 |
| Year 4 | 320 | 290 |
### Key Observations
1. **Chart Trends**:
- IT Hardware spending dominates, peaking in Year 2 and Year 5 projections.
- IT Software spending dips in Year 3 but recovers by Year 4.
- IT Consulting remains relatively stable, with a slight increase in Year 5.
2. **Table Trends**:
- Make Fit Ltd shows fluctuating income, peaking in Year 4 (320).
- Pure Gap Plc has higher income in Year 2 (310) and Year 3 (300) but declines in Year 4 (290).
### Interpretation
- **Spending Patterns**: The legal sector’s IT spending growth (especially Hardware) suggests increasing reliance on technology. The Year 5 projection indicates sustained investment.
- **Firm Performance**: Pure Gap Plc outperforms Make Fit Ltd in Year 2 and 3, while Make Fit Ltd leads in Year 4. This divergence may reflect differing strategic priorities or market positioning.
- **Anomalies**: The sharp drop in IT Software spending in Year 3 (to £15 million) contrasts with its recovery in later years, potentially signaling a temporary shift in priorities or economic factors.
- **Correlation**: While not explicitly stated, the table’s income data could correlate with the chart’s spending trends. For example, Pure Gap Plc’s higher income in Year 2 aligns with its elevated IT Hardware spending that year.
### Spatial Grounding
- The legend is positioned at the top-right, ensuring clarity for chart interpretation.
- The table is placed below the chart, maintaining a logical flow from spending trends to firm-specific outcomes.
### Final Notes
The data highlights the legal sector’s growing IT expenditure, with Hardware and Software as key drivers. The table underscores variability in consultancy firm performance, suggesting opportunities for strategic analysis. Year 5 projections imply optimism about continued growth, though uncertainties remain around the accuracy of these estimates.