\n
## Violin Plot: Search Space Size Comparison of Three Methods
### Overview
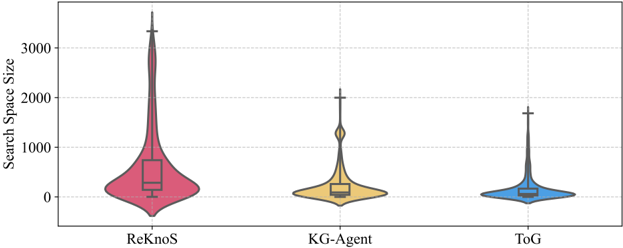
The image displays a violin plot comparing the distribution of "Search Space Size" across three distinct methods or algorithms: ReKnoS, KG-Agent, and ToG. The plot combines a box plot (showing median and interquartile range) with a kernel density plot (showing the probability density of the data at different values), providing a detailed view of the data distribution for each category.
### Components/Axes
* **Chart Type:** Violin Plot with embedded box plots.
* **Y-Axis:**
* **Label:** "Search Space Size"
* **Scale:** Linear scale from 0 to over 3000.
* **Major Tick Marks:** 0, 1000, 2000, 3000.
* **X-Axis:**
* **Categories (from left to right):** "ReKnoS", "KG-Agent", "ToG".
* **Data Series & Color Mapping:**
* **ReKnoS:** Pink/Magenta violin and box plot.
* **KG-Agent:** Yellow/Gold violin and box plot.
* **ToG:** Blue violin and box plot.
* **Embedded Box Plot Elements:** Each violin contains a box plot showing:
* **Median Line:** The central line within the box.
* **Interquartile Range (IQR) Box:** The box itself, spanning the 25th to 75th percentiles.
* **Whiskers:** Lines extending from the box to show the range of the data, excluding outliers.
* **Outliers:** Individual points beyond the whiskers (visible as small horizontal lines or dots at the top of the whiskers).
### Detailed Analysis
**1. ReKnoS (Pink, Leftmost):**
* **Trend/Distribution:** Exhibits the widest and most right-skewed distribution. The violin shape is broad at the bottom and has a very long, thin tail extending upwards.
* **Key Data Points (Approximate):**
* **Median:** ~500
* **Interquartile Range (IQR):** ~100 to ~1000
* **Full Range (Whiskers):** ~0 to ~3500
* **Maximum Value (Tip of Tail):** ~3500
* **Observation:** This method produces the largest search spaces on average and has the highest variability, with some instances resulting in extremely large search spaces.
**2. KG-Agent (Yellow, Center):**
* **Trend/Distribution:** Shows a more compact distribution than ReKnoS but is still right-skewed. The violin is widest near the bottom and has a moderately long tail.
* **Key Data Points (Approximate):**
* **Median:** ~200
* **Interquartile Range (IQR):** ~50 to ~400
* **Full Range (Whiskers):** ~0 to ~2000
* **Maximum Value (Tip of Tail):** ~2000
* **Observation:** KG-Agent generally results in smaller search spaces than ReKnoS, with reduced variability. Its upper range is significantly lower.
**3. ToG (Blue, Rightmost):**
* **Trend/Distribution:** Has the most compact and least skewed distribution of the three. The violin is relatively symmetric and narrow, concentrated at the lower end of the scale.
* **Key Data Points (Approximate):**
* **Median:** ~100
* **Interquartile Range (IQR):** ~25 to ~250
* **Full Range (Whiskers):** ~0 to ~1500
* **Maximum Value (Tip of Tail):** ~1500
* **Observation:** ToG consistently produces the smallest search spaces with the lowest variability among the compared methods.
### Key Observations
1. **Clear Hierarchy:** There is a distinct, stepwise reduction in both the central tendency (median) and spread (IQR, full range) of the Search Space Size from ReKnoS to KG-Agent to ToG.
2. **Skewness:** All three distributions are right-skewed (positively skewed), meaning they have a long tail towards higher values. This indicates that while most runs result in relatively small search spaces, there is a potential for occasional runs to generate very large ones, especially for ReKnoS.
3. **Overlap:** The lower portions of the distributions (near the median and 25th percentile) for all three methods overlap significantly near the bottom of the scale (0-500). The primary differentiation occurs in the upper ranges and the length of the tail.
4. **Outliers:** The top of each whisker represents the maximum non-outlier value. The very long whisker for ReKnoS highlights its propensity for extreme values.
### Interpretation
This chart effectively demonstrates a performance comparison in terms of computational or exploratory efficiency. "Search Space Size" is typically a metric where **lower values are better**, as they imply a more focused, efficient, or constrained search process.
* **ToG is the most efficient method** according to this metric, consistently maintaining the smallest and most predictable search space.
* **KG-Agent offers a middle ground**, significantly improving upon ReKnoS but not reaching the compactness of ToG.
* **ReKnoS is the least efficient and most unpredictable**, often requiring exploration of a much larger space, which could translate to higher computational cost, longer runtimes, or a less directed search strategy.
The data suggests a potential trade-off. The methods might be ordered by increasing sophistication or constraint application (ReKnoS → KG-Agent → ToG), where later methods successfully prune the search space more effectively. The investigation would benefit from knowing what these methods are (e.g., knowledge graph reasoning agents) and whether a smaller search space correlates with better final accuracy or task completion in their specific domain. The pronounced right skew for ReKnoS warrants further investigation into the specific conditions that cause its search space to explode.