## Violin Plot: Comparison of Search Space Sizes for Knowledge Graph Methods
### Overview
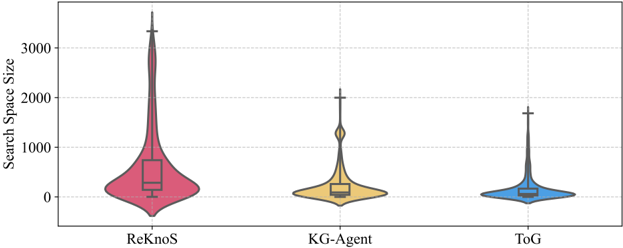
The image presents a comparative visualization of search space sizes for three knowledge graph (KG) methods: ReKnoS, KG-Agent, and ToG. The y-axis represents "Search Space Size" (0–3000), while the x-axis categorizes the methods. Each method is depicted with a violin plot (showing distribution density) and an embedded box plot (showing quartiles and median). The legend on the right maps colors to methods: red for ReKnoS, yellow for KG-Agent, and blue for ToG.
### Components/Axes
- **X-axis**: Labeled with method names (ReKnoS, KG-Agent, ToG), positioned at the bottom.
- **Y-axis**: Labeled "Search Space Size" with a linear scale from 0 to 3000, marked at intervals of 1000.
- **Legend**: Located on the right, associating colors with methods (red = ReKnoS, yellow = KG-Agent, blue = ToG).
- **Violin Plots**: Shaded areas represent distribution density, with black outlines indicating the full range. Embedded box plots (black lines) show medians (horizontal line) and interquartile ranges (box).
### Detailed Analysis
1. **ReKnoS (Red)**:
- **Distribution**: Wide and asymmetric, with a peak near 500 and a long tail extending to ~3000.
- **Box Plot**: Median ~500, Q1 ~300, Q3 ~700. Outlier at ~3000.
- **Uncertainty**: High variability; 95% of data lies between ~200 and ~2500.
2. **KG-Agent (Yellow)**:
- **Distribution**: Narrower and symmetric, peaking around 200–400.
- **Box Plot**: Median ~200, Q1 ~150, Q3 ~250. No outliers.
- **Uncertainty**: Tighter distribution; 95% of data between ~100 and ~500.
3. **ToG (Blue)**:
- **Distribution**: Narrowest and most symmetric, centered near 100–200.
- **Box Plot**: Median ~100, Q1 ~80, Q3 ~120. No outliers.
- **Uncertainty**: Minimal variability; 95% of data between ~50 and ~300.
### Key Observations
- **ReKnoS** exhibits the largest search space, with a significant outlier (~3000) and the widest distribution.
- **KG-Agent** and **ToG** show similar central tendencies but differ in spread: KG-Agent has moderate variability, while ToG is the most constrained.
- The box plots confirm that ReKnoS has the highest median and interquartile range, whereas ToG is the most consistent.
### Interpretation
The data suggests that **ReKnoS** explores a substantially larger search space compared to KG-Agent and ToG, potentially indicating a more exhaustive but computationally intensive approach. The outlier in ReKnoS (~3000) may reflect edge cases or inefficiencies in its search strategy. KG-Agent balances exploration and efficiency, while ToG prioritizes focused, narrow searches. The violin plots highlight that ReKnoS’s distribution is heavily skewed toward larger values, whereas KG-Agent and ToG maintain tighter, more uniform distributions. This could imply trade-offs between coverage and resource usage across the methods.