# Technical Document Extraction: Entity Frequency Analysis Chart
## Chart Type
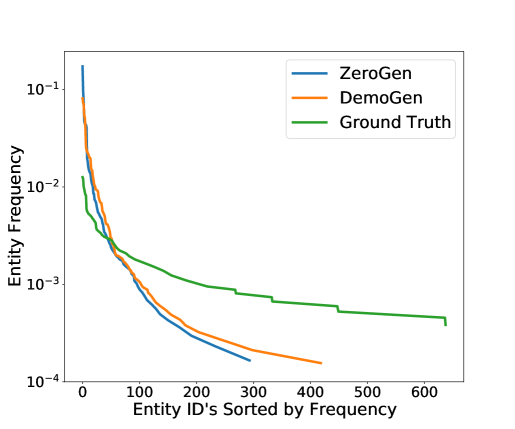
Line chart comparing entity frequency distributions across three models.
## Axis Labels
- **X-axis**: "Entity ID's Sorted by Frequency"
- Range: 0 to 600
- Increment: 100
- **Y-axis**: "Entity Frequency"
- Scale: Logarithmic (10⁻¹ to 10⁻⁴)
- Markers: 10⁻¹, 10⁻², 10⁻³, 10⁻⁴
## Legend
| Model | Color |
|------------|--------|
| ZeroGen | Blue |
| DemoGen | Orange |
| Ground Truth | Green |
## Key Trends
1. **ZeroGen (Blue Line)**
- Starts at ~10⁻¹ frequency (highest initial value).
- Sharp decline to ~10⁻⁴ by x=300.
- Crosses below DemoGen (~x=100).
2. **DemoGen (Orange Line)**
- Begins slightly below ZeroGen (~10⁻¹.⁵).
- Steeper decline than Ground Truth but less severe than ZeroGen.
- Flattens near 10⁻⁴ at x=400.
3. **Ground Truth (Green Line)**
- Starts at ~10⁻² (lowest initial value).
- Gradual, consistent decline to ~10⁻³ at x=600.
- Maintains higher frequency than ZeroGen/DemoGen across all x-values.
## Observations
- **Initial Discrepancy**: ZeroGen and DemoGen overestimate high-frequency entities compared to Ground Truth.
- **Convergence**: All models converge toward lower frequencies as x increases, but Ground Truth retains higher relative frequency.
- **Logarithmic Scale Impact**: Differences in frequency magnitudes are amplified (e.g., 10⁻¹ vs. 10⁻² represents a 10× difference).
## Data Points (Approximate)
| X-axis | ZeroGen | DemoGen | Ground Truth |
|--------|---------|---------|--------------|
| 0 | ~10⁻¹ | ~10⁻¹ | ~10⁻² |
| 100 | ~10⁻² | ~10⁻² | ~10⁻².⁵ |
| 200 | ~10⁻³ | ~10⁻³ | ~10⁻³ |
| 300 | ~10⁻⁴ | ~10⁻³.⁵ | ~10⁻³.² |
| 400 | - | ~10⁻⁴ | ~10⁻³.¹ |
| 600 | - | - | ~10⁻³ |
## Notes
- No embedded text or data tables present.
- All lines exhibit monotonic decline, but Ground Truth demonstrates the slowest rate of decay.
- ZeroGen and DemoGen exhibit similar trajectories but diverge at x=100.