# Technical Document Extraction: Heatmap Analysis of K₁ and E_F Variations
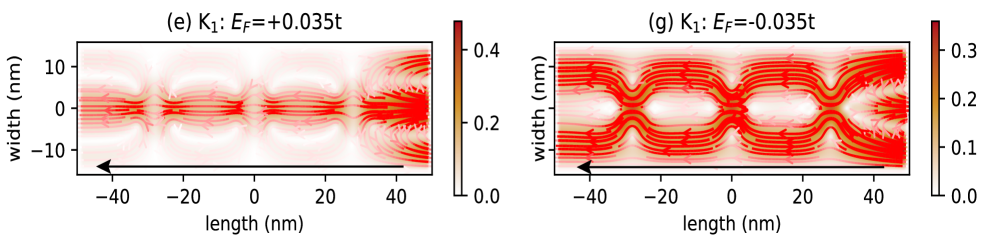
## Panel (e): K₁ with E_F = +0.035t
- **Axis Labels**:
- X-axis: `length (nm)` (range: -40 nm to +40 nm)
- Y-axis: `width (nm)` (range: -10 nm to +10 nm)
- **Color Scale**:
- Right color bar: `0.0` (white) to `0.4` (dark red)
- **Key Observations**:
- Symmetric intensity distribution along the Y-axis.
- Gradual increase in intensity (red) toward the edges of the X-axis (±40 nm).
- Central region (X ≈ 0 nm) exhibits lower intensity (white/yellow).
- Arrows indicate directional flow from left to right along the X-axis.
## Panel (g): K₁ with E_F = -0.035t
- **Axis Labels**:
- X-axis: `length (nm)` (range: -40 nm to +40 nm)
- Y-axis: `width (nm)` (range: -10 nm to +10 nm)
- **Color Scale**:
- Right color bar: `0.0` (white) to `0.3` (dark red)
- **Key Observations**:
- Asymmetric intensity distribution with localized peaks.
- Two prominent high-intensity regions (red) at X ≈ ±20 nm.
- Central region (X ≈ 0 nm) shows reduced intensity (white).
- Arrows indicate directional flow from left to right along the X-axis.
## Cross-Referenced Trends
- **Color Consistency**:
- Red corresponds to higher intensity values in both panels.
- White/yellow indicates lower intensity values.
- **E_F Impact**:
- Positive E_F (+0.035t) in panel (e) results in broader, symmetric intensity distribution.
- Negative E_F (-0.035t) in panel (g) creates localized, asymmetric intensity peaks.
- **Directionality**:
- Arrows in both panels confirm left-to-right flow along the X-axis.
## Summary
The heatmaps visualize the spatial distribution of intensity (color-coded) for two scenarios of K₁ with opposing E_F values. Panel (e) demonstrates a uniform, edge-dominated pattern, while panel (g) exhibits localized intensity maxima at ±20 nm. The directional flow and symmetry differences highlight the influence of E_F on the system's behavior.