## 3D Scatter Plot: Token Position vs. PCA Directions
### Overview
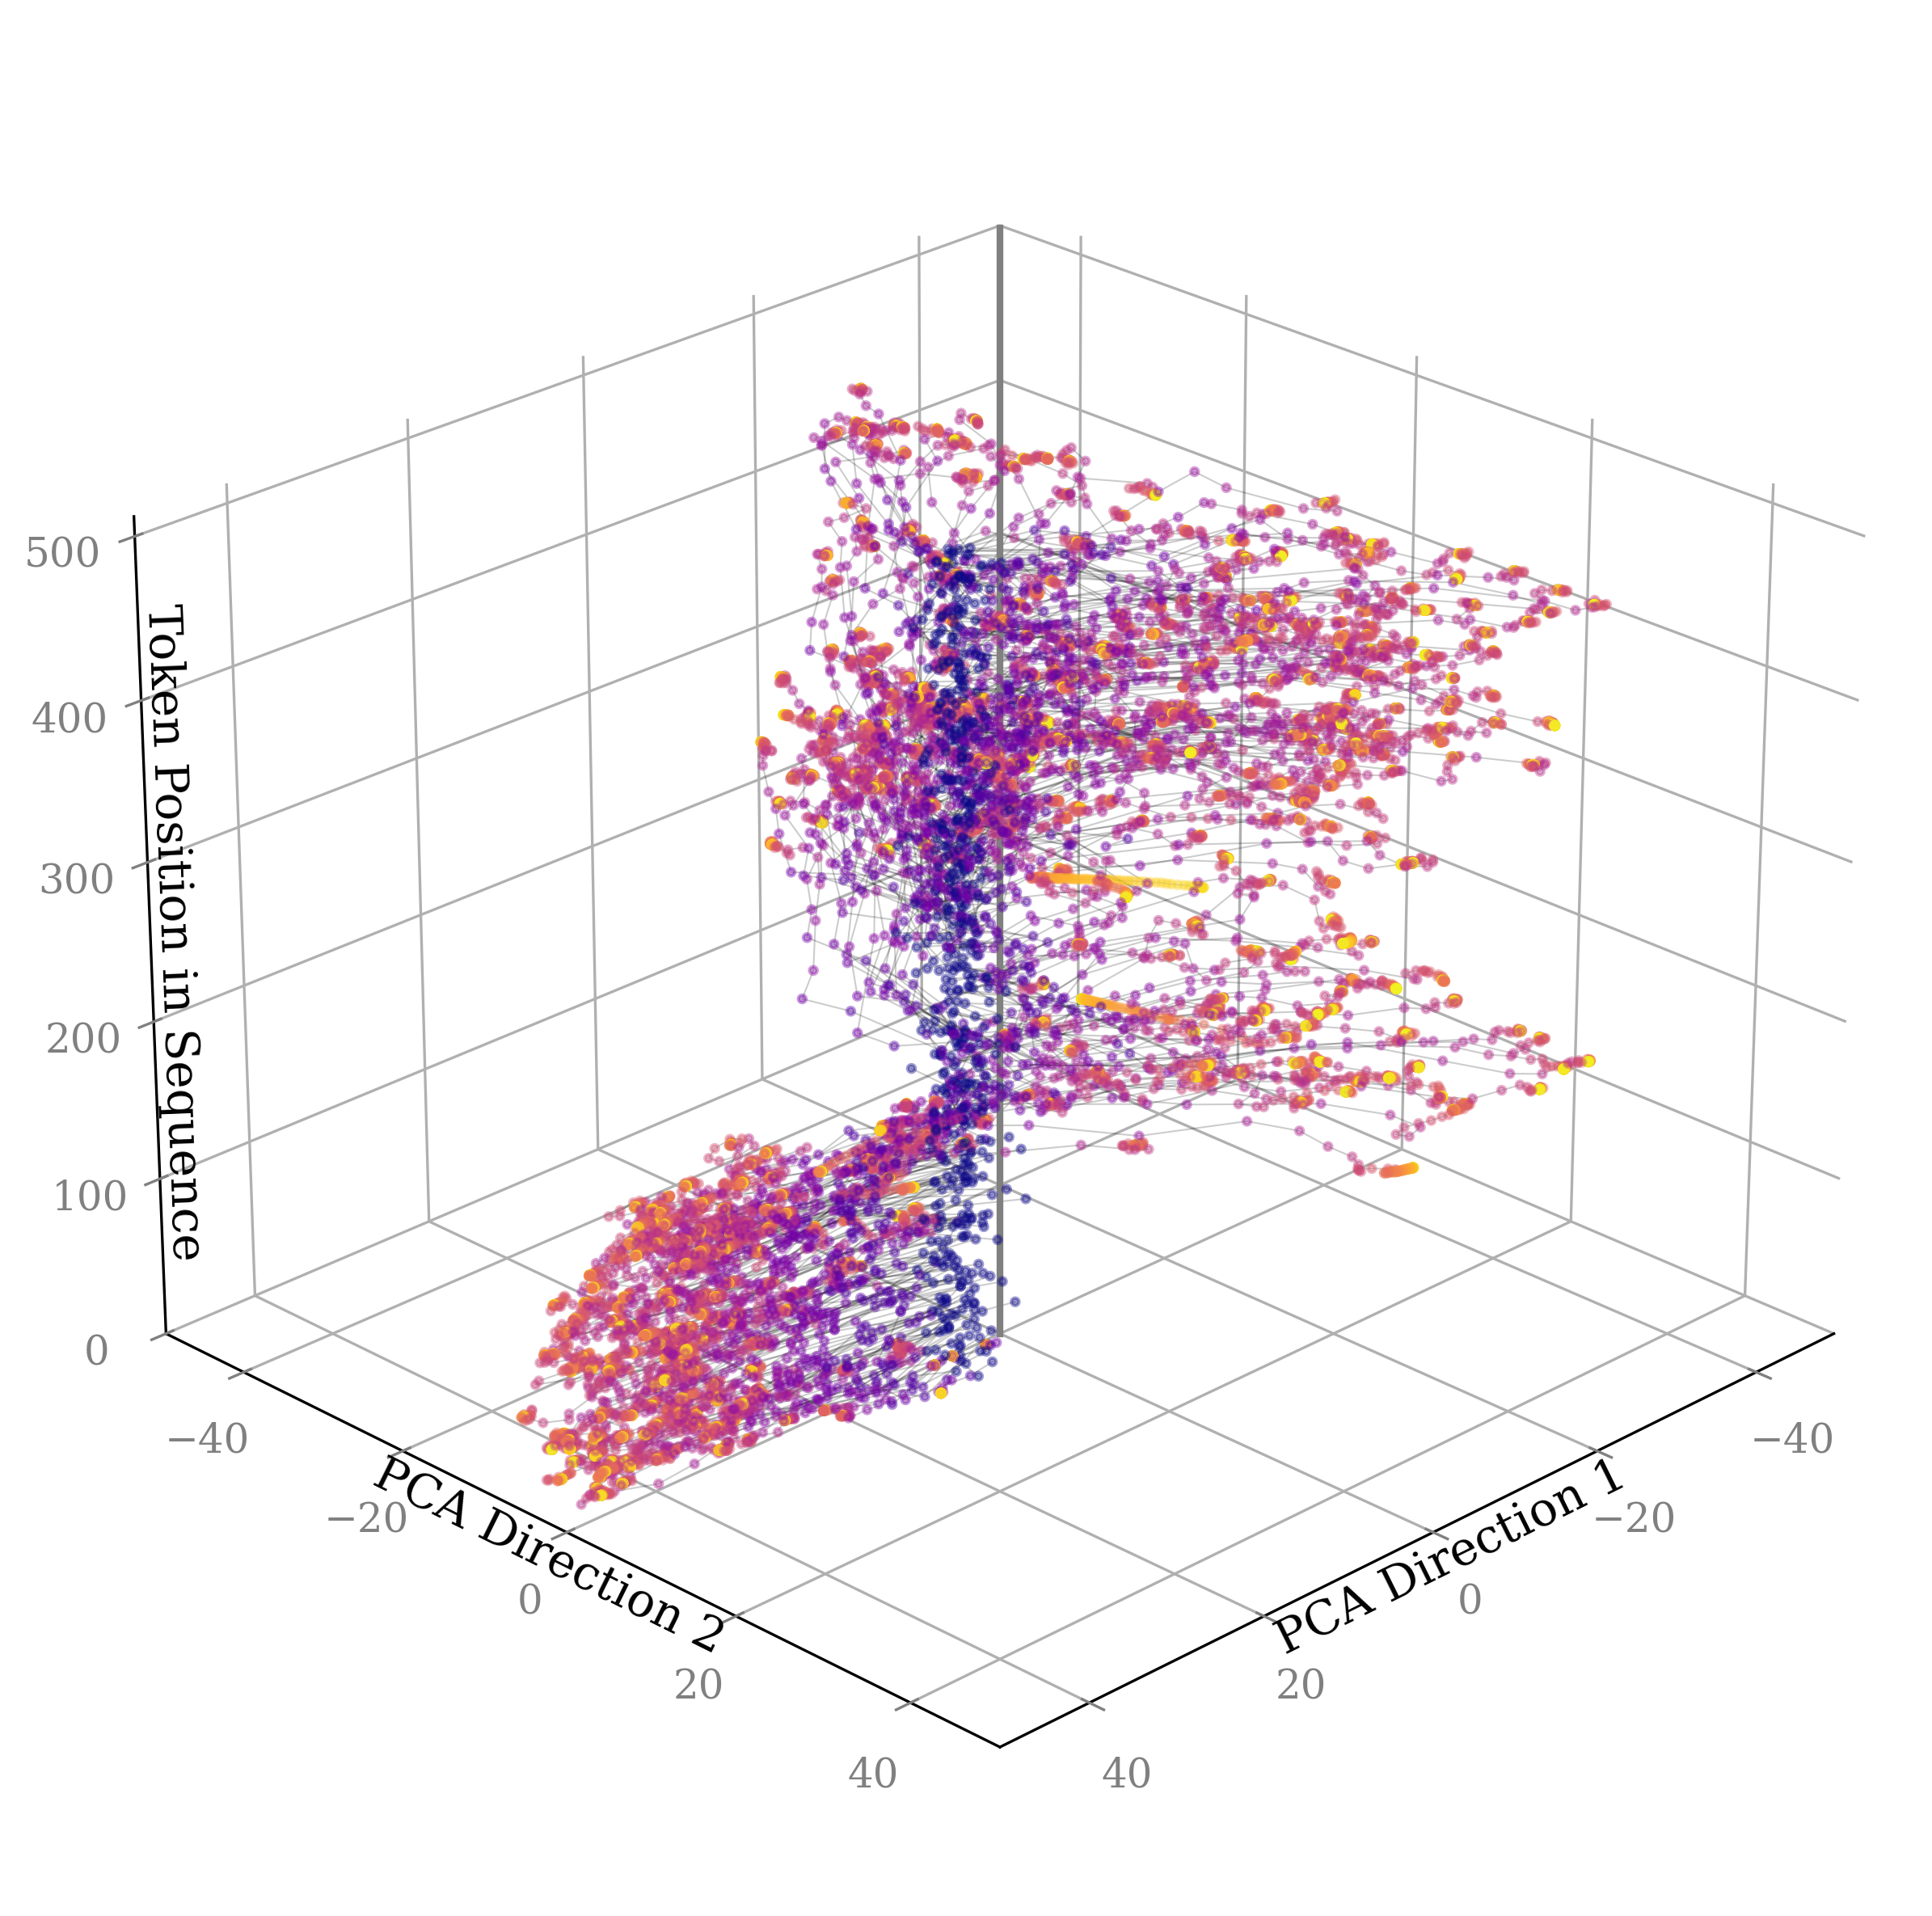
The image is a 3D scatter plot visualizing the relationship between token position in a sequence and two PCA (Principal Component Analysis) directions. Each point represents a token, and its color varies from blue to yellow, potentially indicating another dimension of data. The points are connected by lines, suggesting a sequence or flow.
### Components/Axes
* **X-axis:** PCA Direction 1, ranging from approximately -40 to 40.
* **Y-axis:** PCA Direction 2, ranging from approximately -40 to 40.
* **Z-axis:** Token Position in Sequence, ranging from 0 to 500.
* **Data Points:** Colored points, varying from blue to yellow, connected by lines.
### Detailed Analysis
The data points form a complex structure in 3D space.
* **Initial Cluster:** A dense cluster of points exists at lower token positions (0-100), spanning a wide range of PCA Direction 1 and PCA Direction 2 values. The color of these points is predominantly blue, transitioning to purple and orange.
* **Vertical Structure:** A vertical structure extends upwards along the Z-axis (Token Position) from the initial cluster. This structure is concentrated around PCA Direction 1 = 0 and PCA Direction 2 = 0. The color of these points is predominantly purple and blue.
* **Horizontal Extension:** At higher token positions (around 400-500), the points extend horizontally along both PCA Direction 1 and PCA Direction 2. The color of these points is predominantly orange and yellow.
* **Connections:** The points are connected by lines, indicating a sequence or flow. The lines are thin and gray, making it difficult to discern the exact order of connections.
### Key Observations
* The token positions are not uniformly distributed. There's a concentration at the beginning and a spread at the end.
* The PCA directions seem to separate tokens based on their position in the sequence.
* The color gradient suggests a possible third dimension of information related to the tokens.
### Interpretation
The plot likely represents the embedding of tokens in a high-dimensional space, reduced to two principal components (PCA Directions 1 and 2). The token position in the sequence is then plotted against these components.
The initial cluster suggests that the early tokens in the sequence have similar embeddings. The vertical structure indicates that some tokens maintain similar PCA direction values as the sequence progresses. The horizontal extension at higher token positions suggests that the later tokens diverge in their embeddings.
The color gradient could represent the frequency of the token, its importance, or another relevant feature. Further information about the color mapping would be needed to confirm this.
The connections between points indicate the sequential relationship between tokens. Analyzing the path of these connections could reveal patterns in how the token embeddings evolve over the sequence.