\n
## 3D Scatter Plot: PCA Visualization of Token Embeddings
### Overview
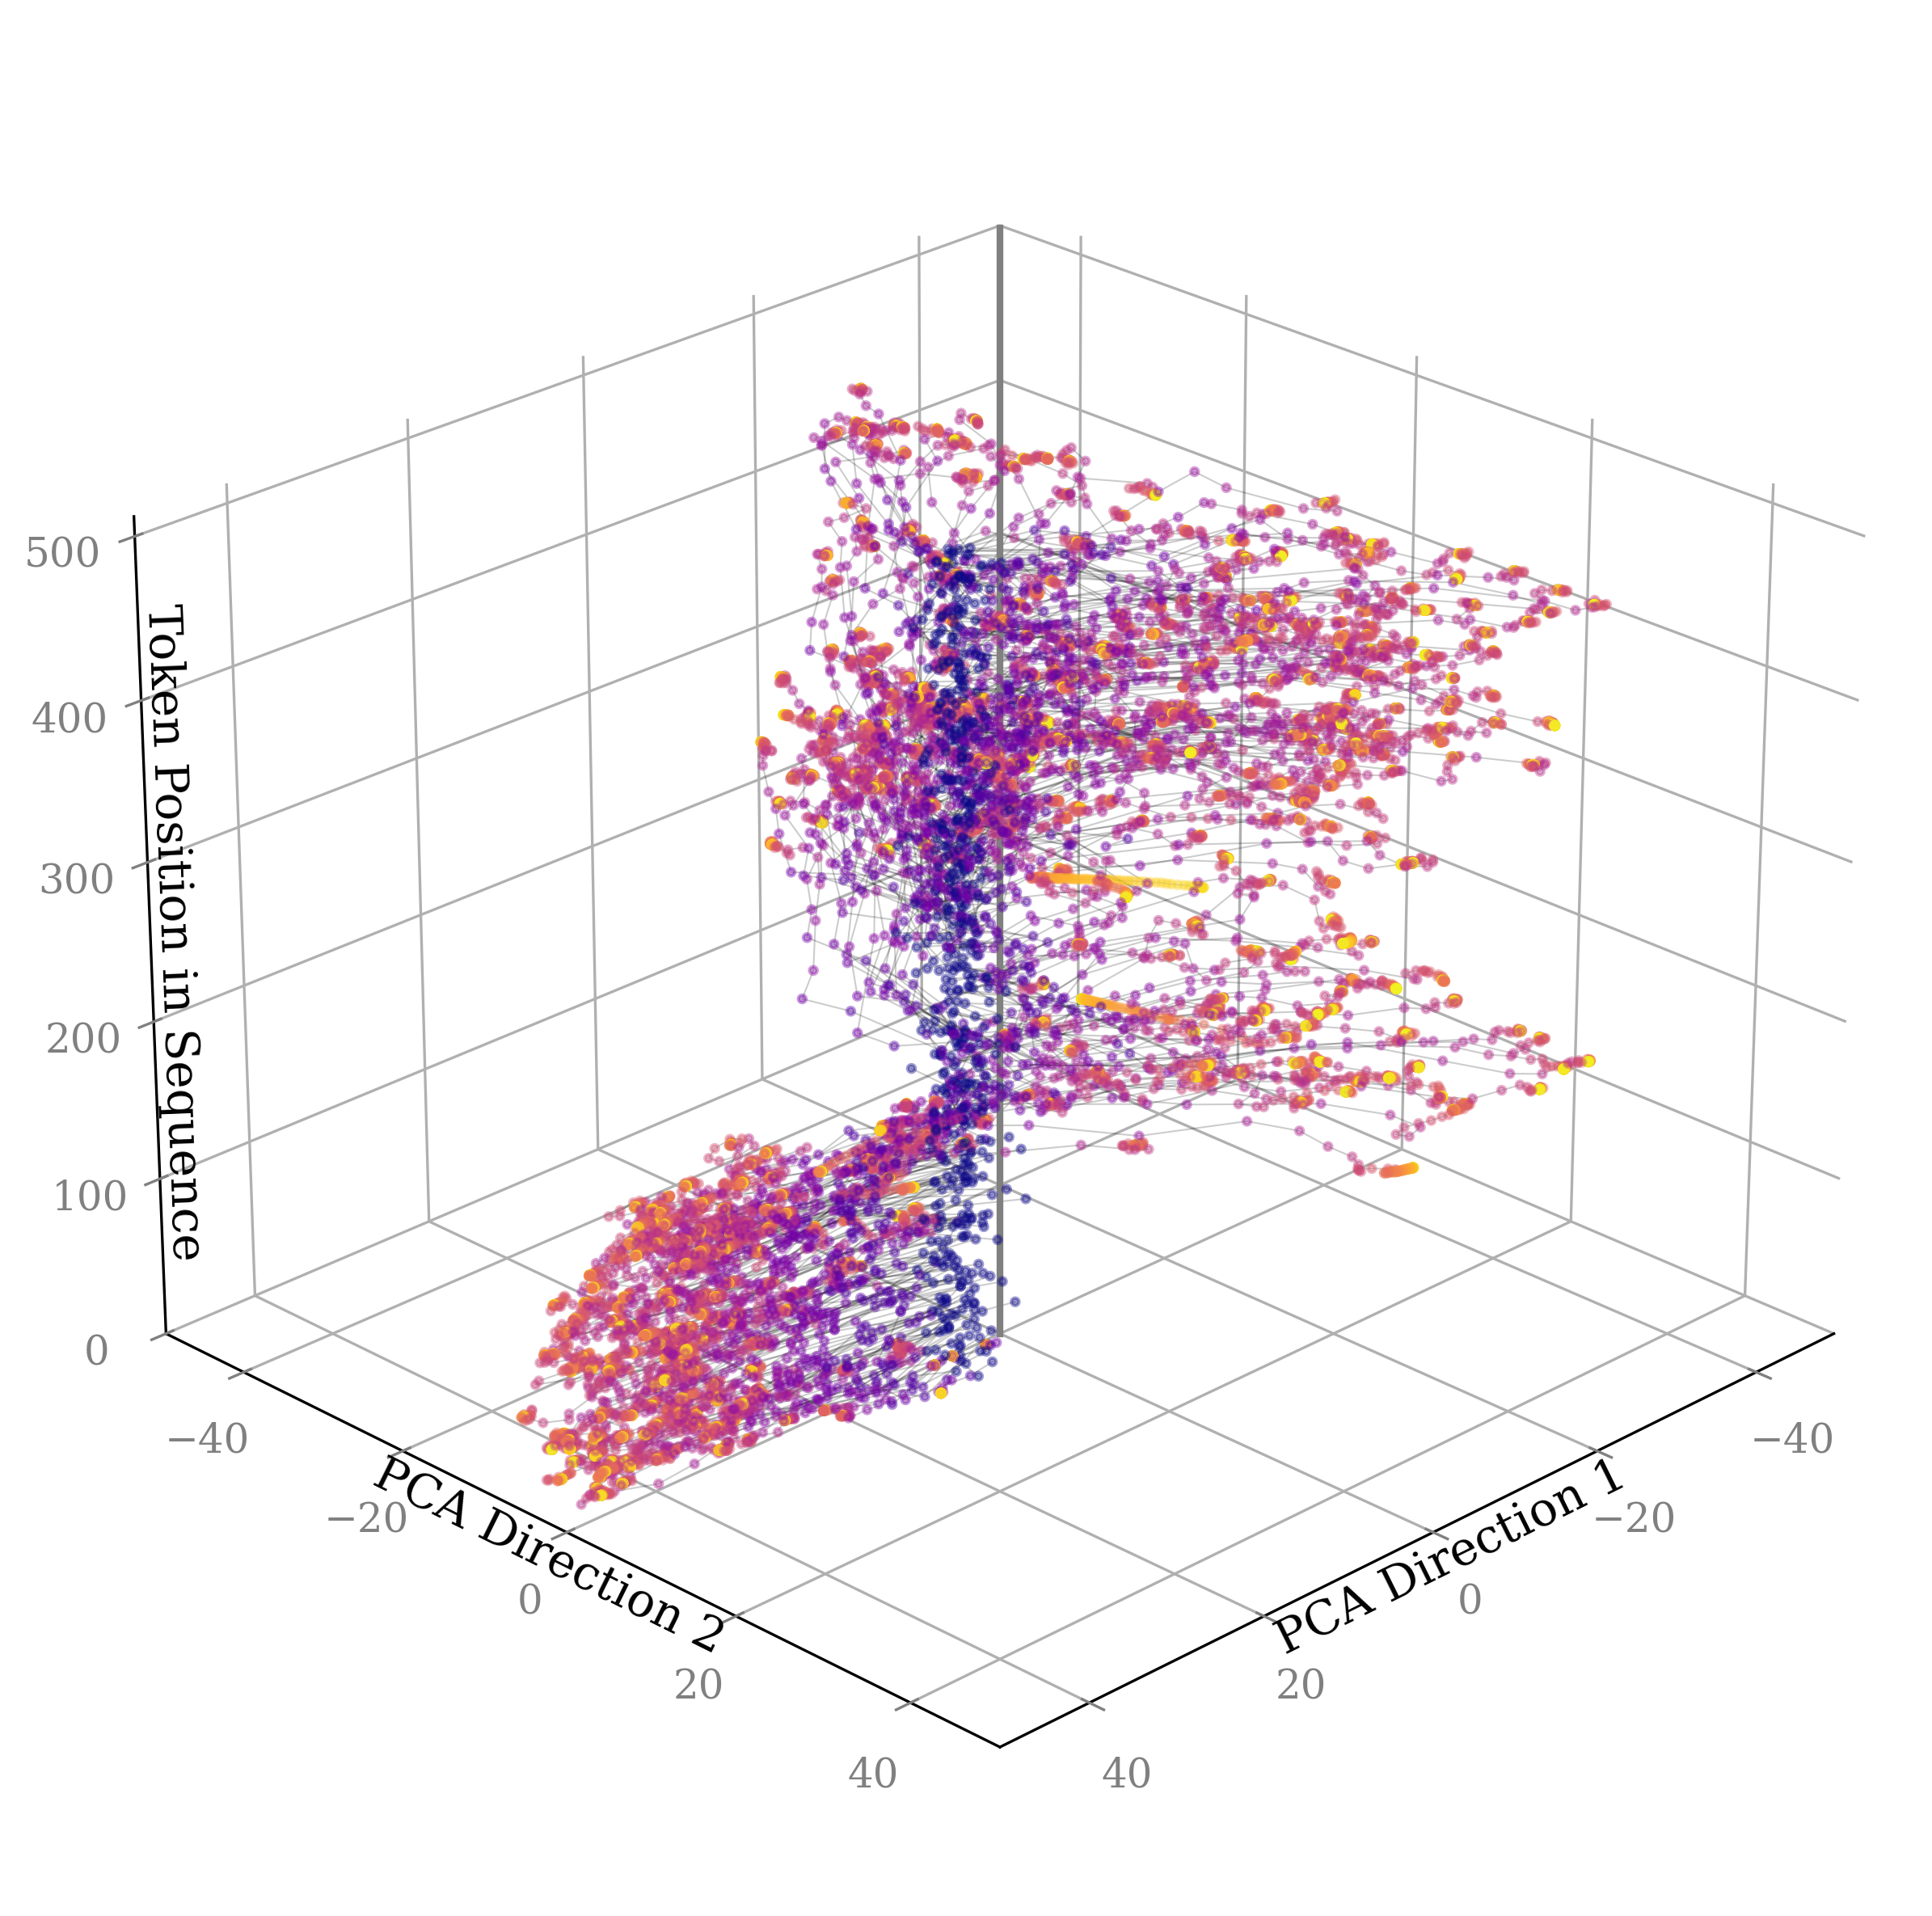
The image presents a 3D scatter plot visualizing the distribution of token embeddings after applying Principal Component Analysis (PCA). The plot displays data points in a three-dimensional space defined by PCA Direction 1, PCA Direction 2, and Token Position in Sequence. The data points are color-coded, with purple and orange representing different clusters or categories of tokens.
### Components/Axes
* **X-axis:** PCA Direction 1, ranging from approximately -40 to 40.
* **Y-axis:** PCA Direction 2, ranging from approximately -40 to 40.
* **Z-axis:** Token Position in Sequence, ranging from approximately 0 to 500.
* **Data Points:** Two distinct color groups: purple and orange. There is no explicit legend, but the color differentiation is clear.
* **Plot Type:** 3D Scatter Plot.
* **Coordinate System:** Cartesian.
### Detailed Analysis
The plot shows two main clusters of data points.
* **Purple Cluster:** This cluster is elongated along the Token Position in Sequence axis (Z-axis). The points are distributed across a range of PCA Direction 1 and PCA Direction 2 values. The cluster appears to start near (PCA Direction 1 = -30, PCA Direction 2 = -20, Token Position = 0) and extends to approximately (PCA Direction 1 = 30, PCA Direction 2 = 20, Token Position = 500). The density of points appears to be higher at lower Token Position values.
* **Orange Cluster:** This cluster is more compact and located in the positive quadrant of PCA Direction 1 and PCA Direction 2. It is centered around (PCA Direction 1 = 20, PCA Direction 2 = 20, Token Position = 300). The range of Token Position values within this cluster is narrower, spanning approximately from 100 to 450.
There is some overlap between the two clusters, particularly in the region where PCA Direction 1 and PCA Direction 2 are both positive.
### Key Observations
* The purple cluster exhibits a clear trend of increasing Token Position in Sequence, suggesting a sequential relationship or ordering of the tokens represented by this cluster.
* The orange cluster is more localized, indicating a more consistent or stable representation of the tokens within this group.
* The separation between the two clusters suggests that the PCA has successfully identified distinct features or characteristics of the token embeddings.
* The lack of a legend makes it difficult to determine the specific meaning of the color coding.
### Interpretation
This visualization likely represents the embedding space of tokens from a sequence (e.g., a sentence or document) after dimensionality reduction using PCA. The two clusters likely correspond to different types of tokens or different semantic categories.
The purple cluster's elongation along the Token Position axis suggests that these tokens are ordered in a meaningful way within the sequence. This could represent, for example, the sequential flow of words in a sentence. The orange cluster, being more compact, might represent tokens that are less dependent on their position in the sequence or that share a common semantic feature.
The separation between the clusters indicates that the PCA has captured important variations in the token embeddings, allowing for a clear distinction between the two groups. The overlap suggests that some tokens may exhibit characteristics of both groups.
Without further information about the data and the embedding model used, it is difficult to provide a more specific interpretation. However, this visualization provides valuable insights into the structure and organization of the token embeddings and the relationships between different tokens within the sequence.