## 3D Scatter Plot: Token Position vs PCA Directions
### Overview
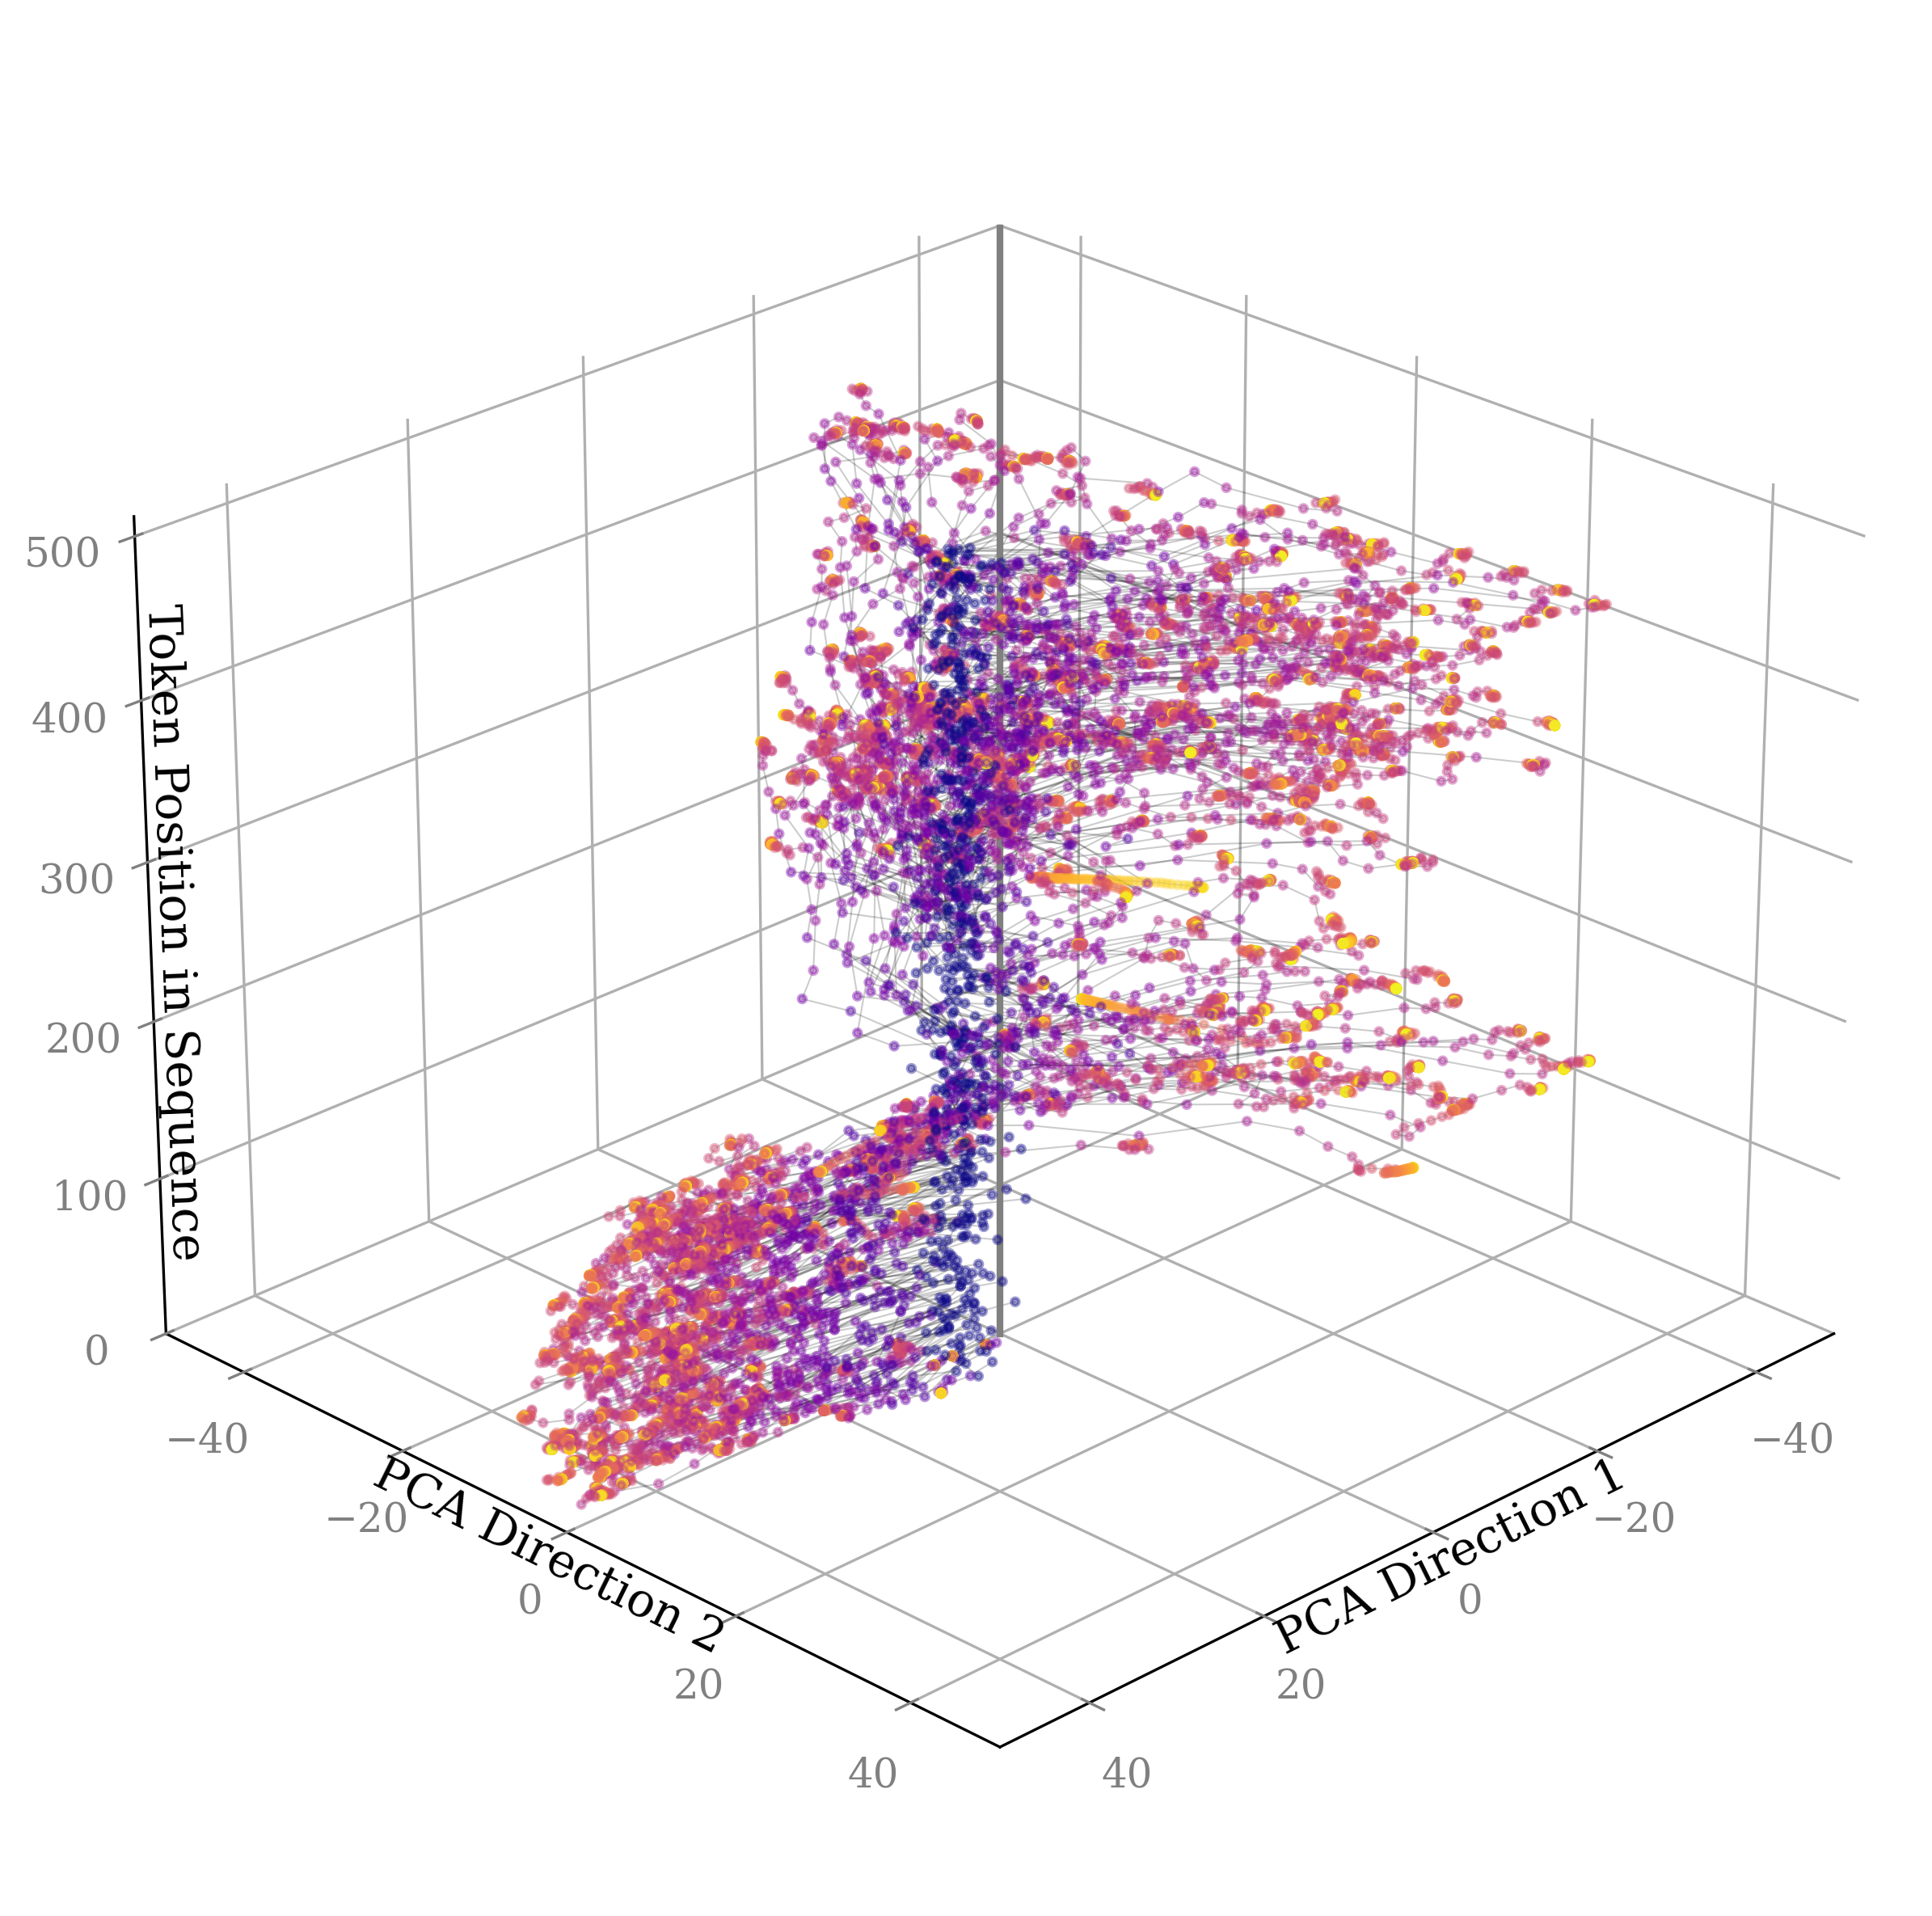
The image depicts a 3D scatter plot visualizing the relationship between token positions in a sequence and two principal component analysis (PCA) directions. Data points are color-coded and connected by lines, suggesting a progression or clustering pattern across the three dimensions.
---
### Components/Axes
- **X-axis (PCA Direction 1)**: Ranges from -40 to 40.
- **Y-axis (PCA Direction 2)**: Ranges from -40 to 40.
- **Z-axis (Token Position in Sequence)**: Ranges from 0 to 500.
- **Legend**: Located on the right side of the plot, with four color categories:
- Purple (darkest)
- Red
- Orange
- Yellow (brightest)
---
### Detailed Analysis
1. **Data Distribution**:
- Points are densely clustered around the center of the plot (near PCA1 = 0, PCA2 = 0) but spread outward along the PCA axes.
- Token positions (Z-axis) vary significantly, with some points reaching up to 500 and others as low as 0.
2. **Color Gradient**:
- Purple dominates the lower-left region (negative PCA1, negative PCA2).
- Red and orange transition toward the center and upper-right quadrant (positive PCA1, positive PCA2).
- Yellow is concentrated in the upper-right region (high PCA1, high PCA2).
3. **Line Connections**:
- Lines connect points across the PCA axes, indicating a directional flow or progression.
- Lines originating from the lower-left (purple) cluster extend toward the upper-right (yellow) cluster, suggesting a sequential or hierarchical relationship.
4. **Token Position Trends**:
- High token positions (Z-axis > 400) are predominantly in the upper-right quadrant (positive PCA1 and PCA2).
- Low token positions (Z-axis < 100) are clustered in the lower-left quadrant (negative PCA1 and PCA2).
---
### Key Observations
- **Cluster Separation**: Three distinct clusters are visible:
1. **Lower-left (Purple)**: Low PCA1, low PCA2, low token positions (~0–100).
2. **Central (Red/Orange)**: Moderate PCA1/PCA2, moderate token positions (~100–300).
3. **Upper-right (Yellow)**: High PCA1, high PCA2, high token positions (~300–500).
- **Flow Direction**: Lines predominantly move from lower-left to upper-right, implying a progression from low to high PCA values and token positions.
- **Outliers**: A few isolated points deviate from the main clusters, particularly in the upper-left quadrant (negative PCA1, positive PCA2).
---
### Interpretation
- **PCA Axes**: The PCA directions likely represent the primary axes of variation in the data, with PCA1 and PCA2 capturing the most significant patterns.
- **Token Position Correlation**: Token positions correlate strongly with PCA1 and PCA2, suggesting that higher token positions are associated with specific directional patterns in the data.
- **Color Coding**: The gradient from purple to yellow may represent a categorical or sequential variable (e.g., time, hierarchy, or class labels).
- **Flow Lines**: The connected lines imply a dynamic process, such as transitions between states or hierarchical relationships.
This visualization highlights how token positions and PCA directions interact, potentially revealing underlying structures in the data, such as groupings, trends, or dependencies.