## Line Chart: Reward vs Steps (Mean Min/Max)
### Overview
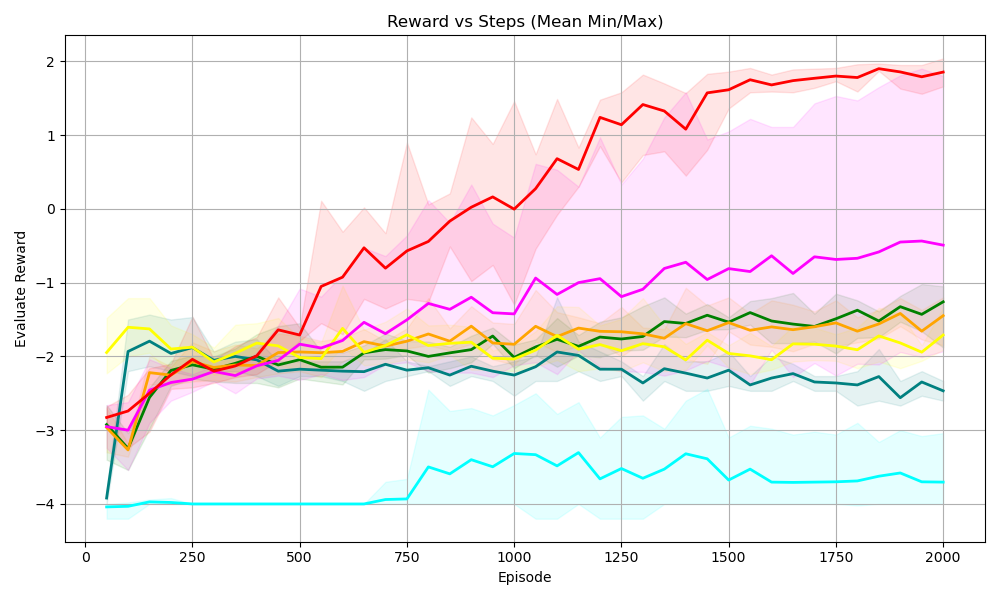
The chart visualizes the performance of multiple reinforcement learning (RL) algorithms over training episodes, comparing their evaluation rewards against the number of steps taken. Each line represents an algorithm's mean reward trajectory, with shaded areas indicating the minimum and maximum reward variability.
### Components/Axes
- **X-axis (Episode)**: Ranges from 0 to 2000 in increments of 250.
- **Y-axis (Evaluation Reward)**: Spans from -4 to 2 in increments of 1.
- **Legend**: Located on the right, mapping colors to algorithms:
- Red: PPO
- Pink: A3C
- Yellow: SAC
- Green: DDPG
- Orange: TD3
- Blue: C51
### Detailed Analysis
1. **PPO (Red Line)**:
- Starts at ~-3.0 (episode 0).
- Sharp upward trend, peaking at ~1.8 by episode 2000.
- Shaded area widest initially (~1.0 range), narrowing to ~0.5 by episode 2000.
2. **A3C (Pink Line)**:
- Begins at ~-3.2, rising steadily to ~-0.5 by episode 2000.
- Shaded area remains relatively consistent (~0.8 range).
3. **SAC (Yellow Line)**:
- Starts at ~-2.5, fluctuates between ~-2.0 and ~-1.5.
- Shaded area shows moderate variability (~0.7 range).
4. **DDPG (Green Line)**:
- Begins at ~-3.0, rises to ~-1.2 by episode 2000.
- Shaded area widens slightly (~0.9 range).
5. **TD3 (Orange Line)**:
- Starts at ~-3.0, peaks at ~-1.0 by episode 2000.
- Shaded area shows gradual narrowing (~0.6 range).
6. **C51 (Blue Line)**:
- Starts at ~-4.0, ends at ~-3.5.
- Shaded area remains flat (~0.5 range).
### Key Observations
- **PPO** demonstrates the highest reward and most consistent improvement.
- **A3C** outperforms other algorithms except PPO.
- **C51** shows the least improvement, remaining near -4.0 initially.
- All algorithms exhibit upward trends, but PPO and A3C diverge significantly from others.
### Interpretation
The chart highlights PPO's superiority in reward efficiency and stability, likely due to its policy optimization mechanism. A3C's steady climb suggests effective asynchronous training. SAC and DDPG show moderate gains, while TD3 and C51 lag, possibly due to exploration-exploitation trade-offs or reward function sensitivity. The shaded areas indicate that PPO's early variability decreases as it stabilizes, whereas C51's flat performance suggests limited adaptability. This data underscores the importance of algorithm design in balancing exploration and reward maximization.