## Bar Chart: Used Weights per Layer
### Overview
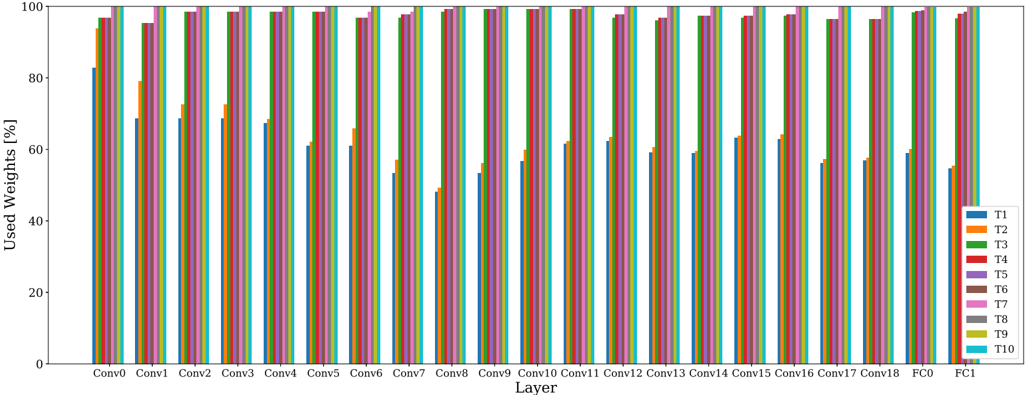
The image is a bar chart displaying the percentage of used weights for different layers in a convolutional neural network. The x-axis represents the layers (Conv0 to Conv18, FC0, and FC1), and the y-axis represents the percentage of used weights, ranging from 0% to 100%. Each layer has multiple bars, each representing a different "T" value (T1 to T10), indicated by a color-coded legend.
### Components/Axes
* **X-axis:** "Layer" - Categorical axis with labels: Conv0, Conv1, Conv2, Conv3, Conv4, Conv5, Conv6, Conv7, Conv8, Conv9, Conv10, Conv11, Conv12, Conv13, Conv14, Conv15, Conv16, Conv17, Conv18, FC0, FC1.
* **Y-axis:** "Used Weights [%]" - Numerical axis ranging from 0 to 100, with tick marks at 20, 40, 60, 80, and 100.
* **Legend:** Located on the right side of the chart. It maps colors to "T" values:
* Blue: T1
* Orange: T2
* Green: T3
* Red: T4
* Purple: T5
* Brown: T6
* Pink: T7
* Gray: T8
* Yellow: T9
* Teal: T10
### Detailed Analysis
The chart shows the percentage of used weights for each layer, broken down by the "T" values.
* **Conv0 - Conv18:** For convolutional layers Conv0 through Conv18, the percentage of used weights varies depending on the "T" value.
* T1 (Blue): Starts around 83% for Conv0 and generally increases to around 95-98% for Conv18.
* T2 (Orange): Starts around 70% for Conv0 and increases to around 95-98% for Conv18.
* T3 (Green): Starts around 90% for Conv0 and remains high, around 98-99% for Conv18.
* T4 (Red): Starts around 93% for Conv0 and remains high, around 98-99% for Conv18.
* T5 (Purple): Starts around 95% for Conv0 and remains high, around 98-99% for Conv18.
* T6 (Brown): Starts around 65% for Conv0 and increases to around 95-98% for Conv18.
* T7 (Pink): Starts around 97% for Conv0 and remains high, around 98-99% for Conv18.
* T8 (Gray): Starts around 98% for Conv0 and remains high, around 98-99% for Conv18.
* T9 (Yellow): Starts around 99% for Conv0 and remains high, around 98-99% for Conv18.
* T10 (Teal): Starts around 99% for Conv0 and remains high, around 98-99% for Conv18.
* **FC0 and FC1:** The fully connected layers FC0 and FC1 show a significant drop in the percentage of used weights compared to the convolutional layers.
* FC0: T1-T10 values are all around 50-60%.
* FC1: T1-T10 values are all around 95-99%.
### Key Observations
* The percentage of used weights is generally high for all convolutional layers (Conv0-Conv18) and for T3-T10.
* There is a noticeable drop in the percentage of used weights for FC0 compared to the convolutional layers.
* FC1 shows a high percentage of used weights, similar to the later convolutional layers.
* T1, T2, and T6 show lower used weights in the earlier convolutional layers (Conv0-Conv3) compared to T3-T10.
### Interpretation
The data suggests that the convolutional layers are generally utilizing a high percentage of their weights, especially for T3-T10. The drop in used weights for FC0 indicates that this layer might be less efficient or have a different role in the network, potentially acting as a bottleneck. The subsequent increase in used weights for FC1 suggests that the network is recovering or adapting after the FC0 layer. The lower used weights for T1, T2, and T6 in the earlier convolutional layers could indicate that these "T" values are less important or are being pruned during training in the initial layers. The consistent high usage of weights for T3-T10 across all convolutional layers suggests that these "T" values are crucial for feature extraction throughout the network.